In our inaugural Generational Power Index (GPI) 2021, we examine the power and influence each generation currently holds on American society, and its potential to evolve in the future. Political power by generation was one of three key categories we used to quantify the current landscape. Before we dive into the results, here’s how the Political Power category was calculated.
Measuring Generational Power
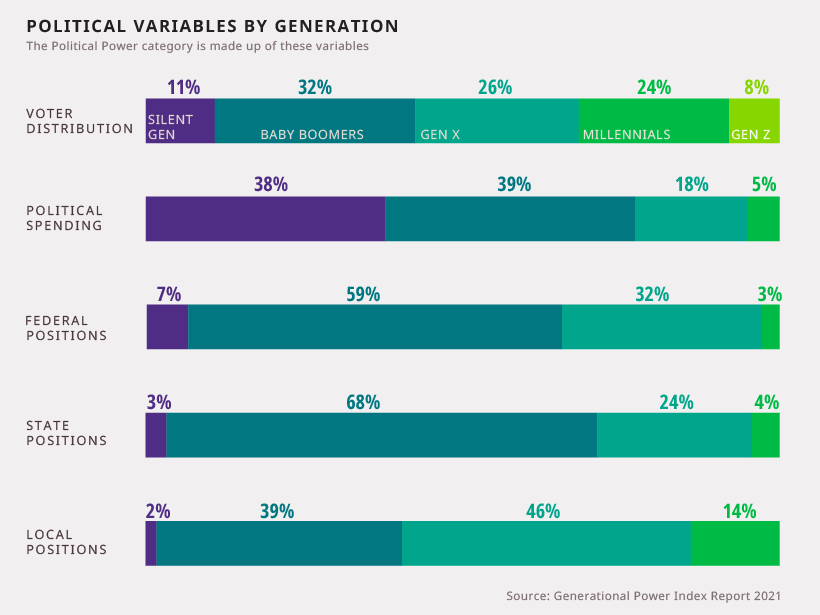
To begin with, here’s how we categorized each generation: Using these age groups as a framework, we then calculated the Political Power category using these distinct equally-weighted variables:
With this methodology in mind, here’s how the Political Power category shakes out, using insights from the GPI.
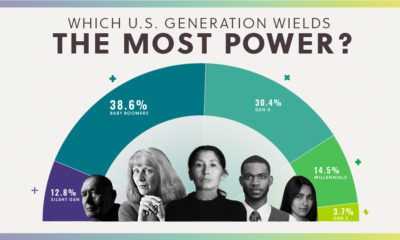
Share of Political Power by Generation
Baby Boomers dominated with over 47% of the total political power by generation. This cohort has particular strength in the judicial system and in Congress. Baby Boomers, along with the Silent Generation also control 80% of political spending. Meanwhile, Gen X accounts for nearly half (46%) of local government positions. Both voters and politicians play key roles in shaping American society. Thus, two variables worth looking closer at are the evolving electoral base and the composition of Congress.
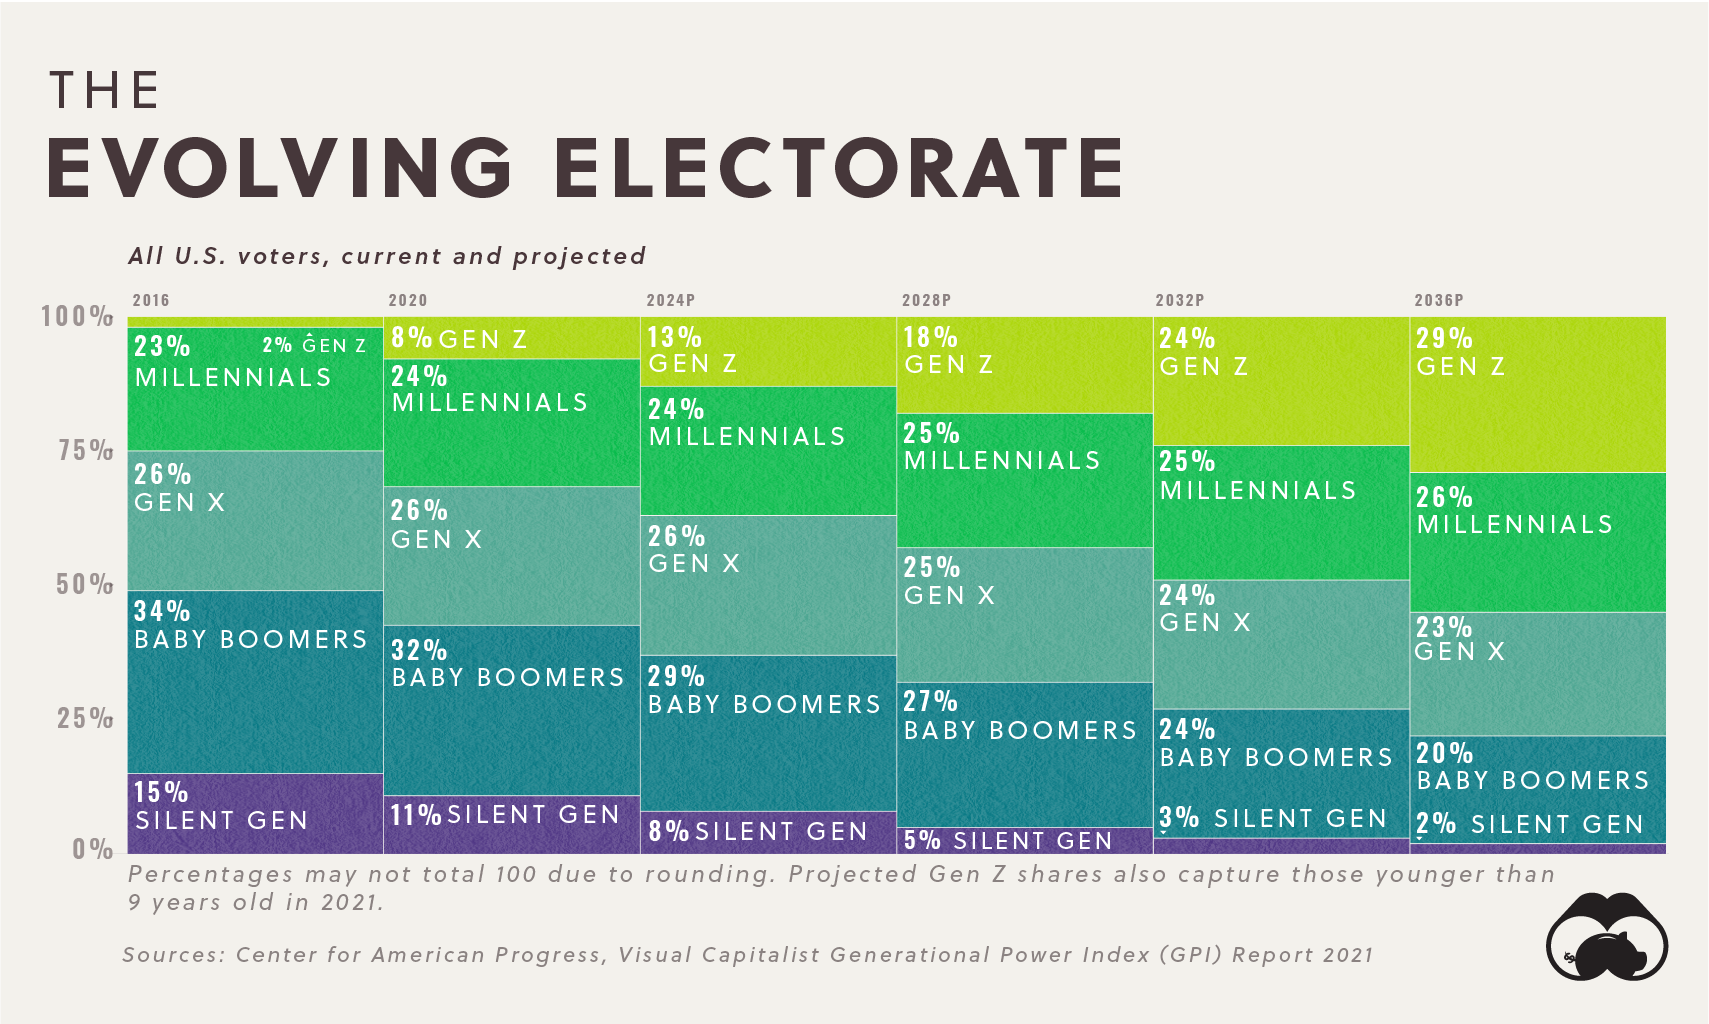
The Changing Face of the U.S. Voter
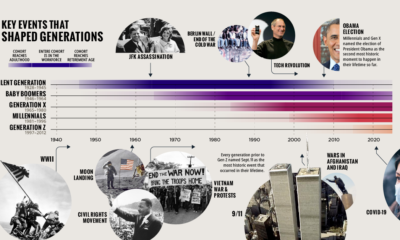
Younger generations have very different perceptions on everything from cannabis to climate change. This is starting to be reflected in legislation. 2016 was a watershed moment for politicians vying for the vote—it was the last election in which Baby Boomers made up over a third of U.S. voters. Collectively, Boomers’ voting power will decline from here on out.
Within the next two decades, the combined voting power of Millennials and Gen Z will skyrocket from 32% in 2020 up to 55% by 2036. Meanwhile, a decade from now, the oldest members of Gen Alpha (those born in 2013 and later) will enter the playing field and become eligible to vote in 2031.
The View from the Top
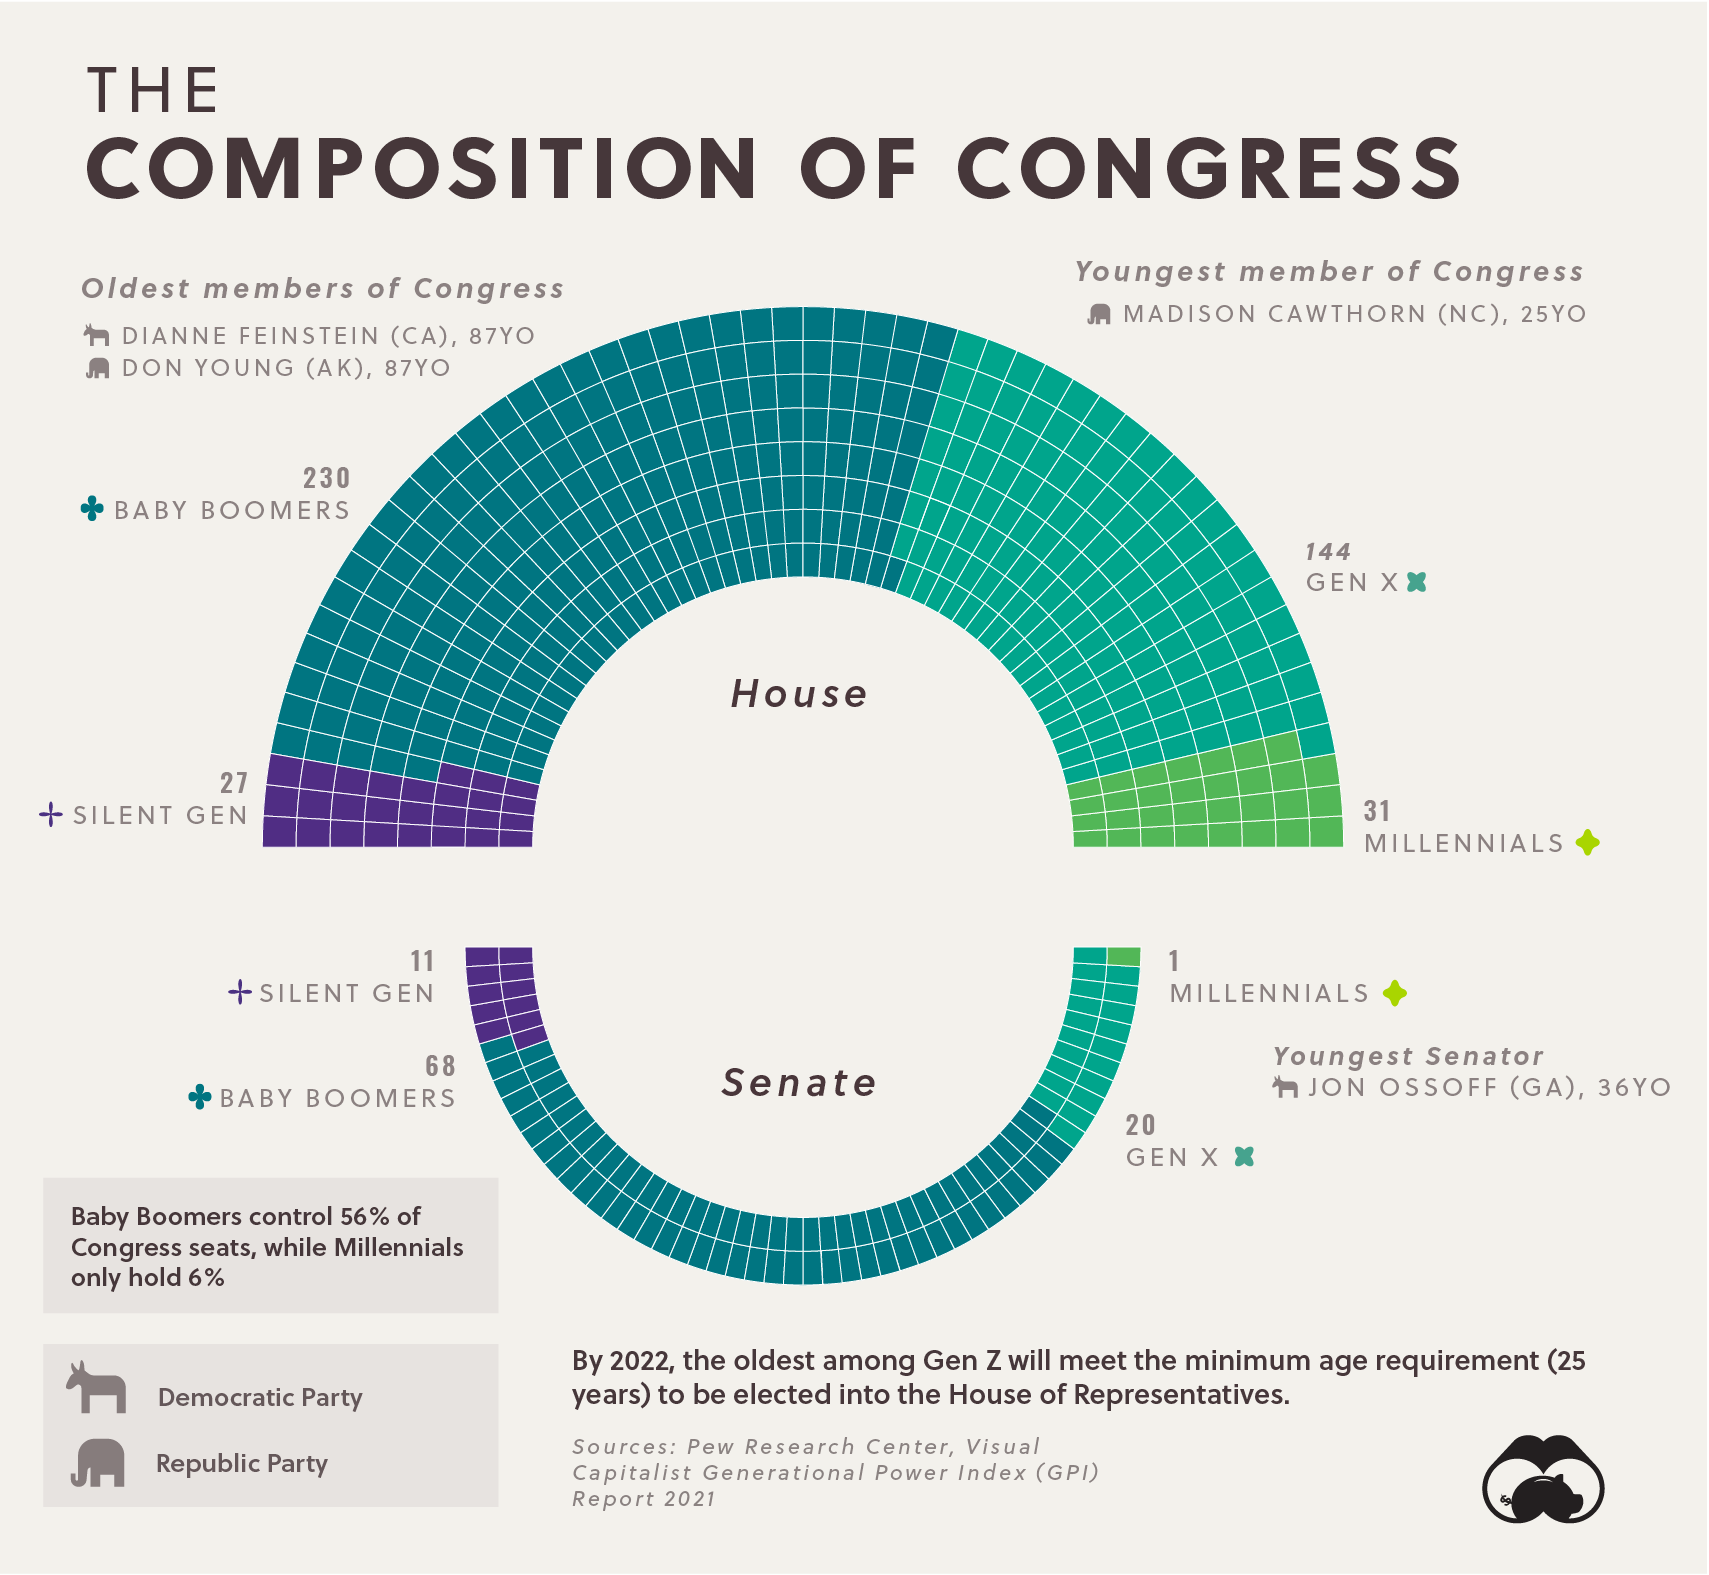
Having examined generational power in the electorate, we now turn our attention to the people on the other side of the democratic equation—the politicians. In most cases, it takes many decades of experience and reputation building to reach the highest offices in the land. That’s why the median age of Congress (61.2) is much higher than the median age of the U.S. population at large (38.1). At this point in time, Baby Boomers are in the sweet spot, and it shows in the numbers. Boomers represent 298 of 532 Congressional seats (56% of all seats), and Gen X’s growing contingent of members represents 31%.
On one end of the spectrum, the Silent Generation still occupies 7% of seats, which roughly reflects the group’s share of the U.S. population. California’s Democratic Senator Dianne Feinstein and Republican Don Young are both 87 years old, the latter having represented Alaska for 25 terms. On the other end of the spectrum, Millennials currently claim 32 seats, just 6% of the total. As of 2021, this entire cohort now meets the minimum age requirement (25) to serve in the House of Representatives. The youngest member of Congress is Republican Madison Cawthorn, a representative for North Carolina at just 25 years old. Meanwhile, Senator Jon Ossoff is the youngest Senator in the country, serving Georgia at 36 years old.
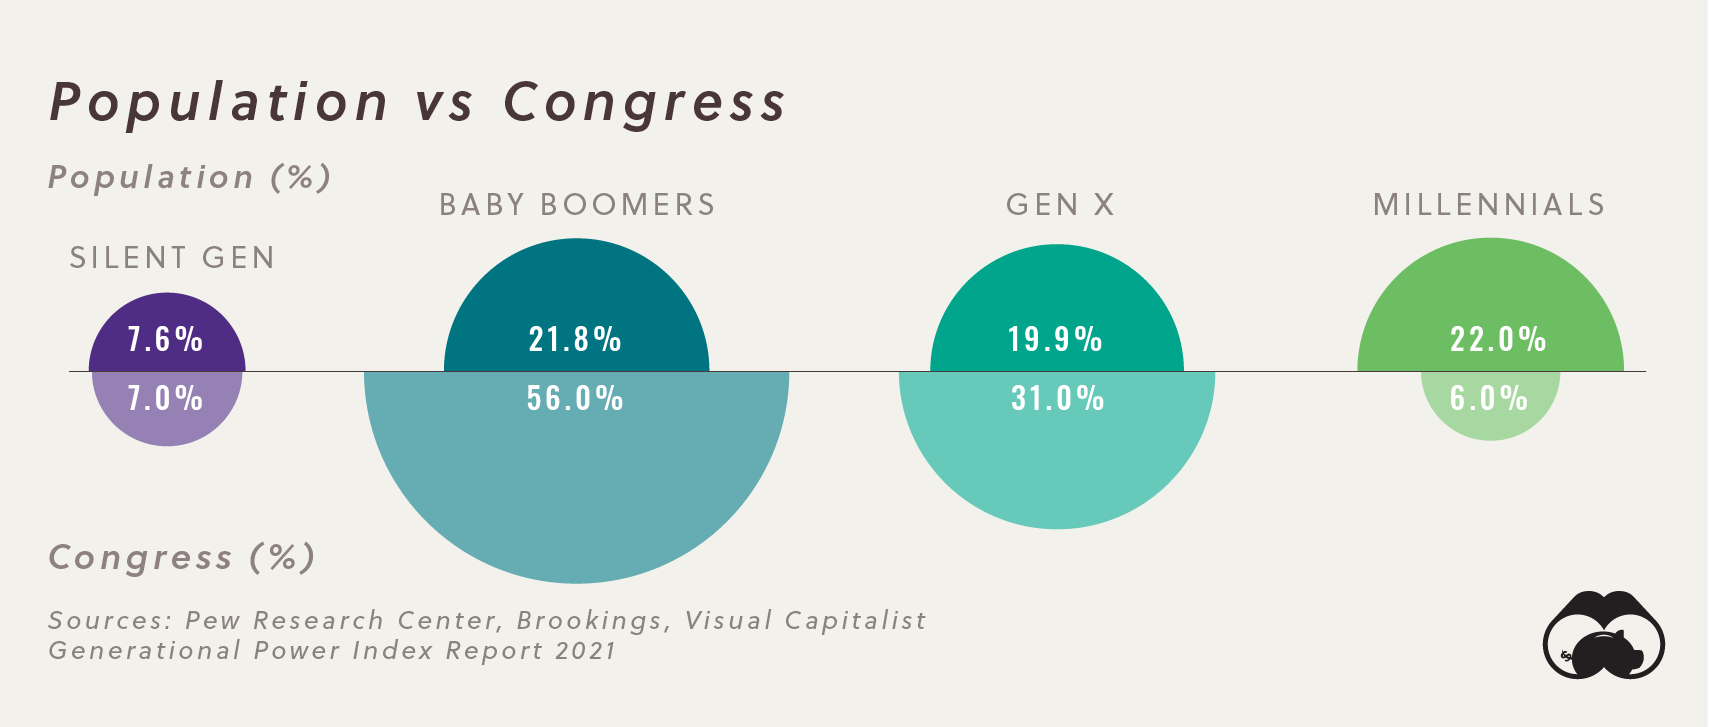
This difference in political power by generation is stark considering that both Boomers and Millennials both make up similar proportions of the U.S. population at large. In that sense, Millennials are greatly underrepresented in Congress compared to Boomers.
Gen Z Waiting Patiently in the Wings
Gen Z’s current age range is a natural reason why they don’t yet have a foothold in government. But by 2022, the oldest members of Gen Z will turn 25, meeting the minimum age requirement to get elected into the House of Representatives. With the oldest members of this generation soon turning 25, how long will it be before a representative from Gen Z occupies a seat in the Capitol Building? Download the Generational Power Report (.pdf)
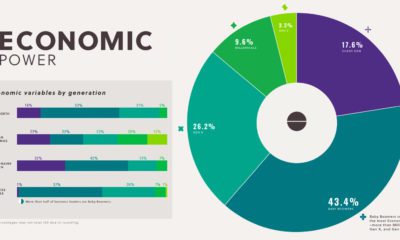
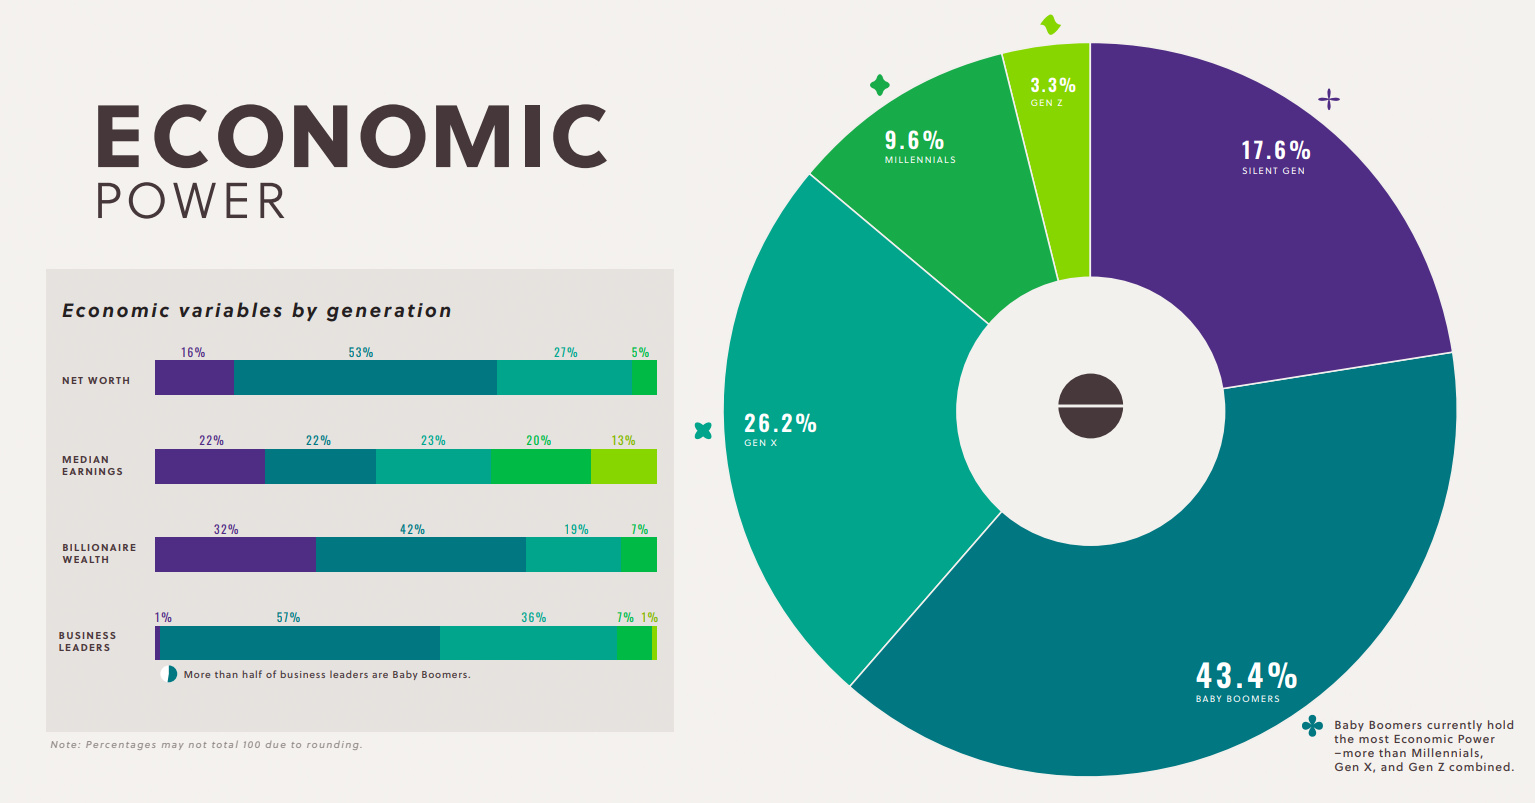
on And when it comes to money and economic power, our research has concluded that Baby Boomers, those between the ages of 57-75, have more influence than Millennials, Gen X, and Gen Z combined. These findings may seem intuitive, but what exactly contributes to economic power? To find out, let’s take a closer look at the GPI’s underlying variables.
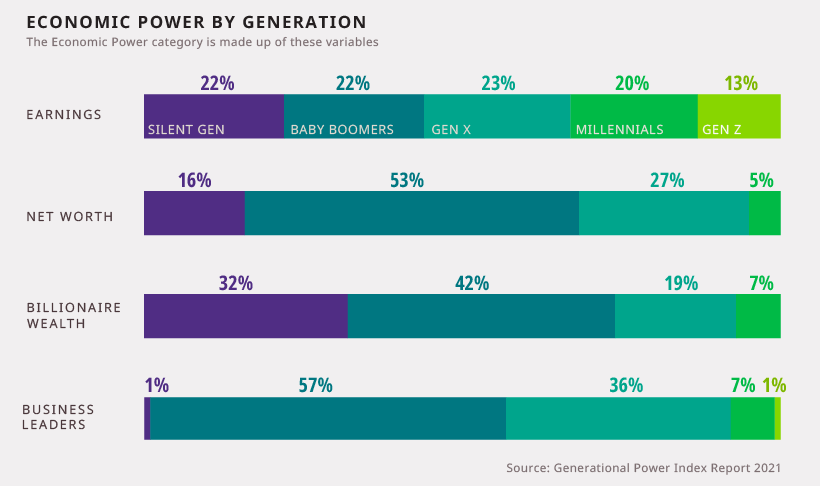
The Building Blocks of Economic Power
Our starting point was to define the age ranges of each generation: Using these ranges as a framework, we then calculated our four underlying variables of economic power. Here’s what the distribution within each one looked like:
The earnings variable represents the median weekly earnings of full-time workers in the U.S., and was the most evenly distributed of the four variables. Gen Z had the lowest median weekly earnings ($614), while Gen X had the highest ($1,103). Boomers established a clear lead in the second variable, net worth, which represents each generation’s share of overall U.S. wealth. As it turns out, Boomers hold 53% of all wealth in the country—more than all other generations combined. The third variable captures each generation’s share of billionaire wealth, and was dominated by Boomers and the Silent Gen. We calculated this variable by starting with the top 1,000 billionaires globally, then filtering for Americans only. The final variable, business leaders, is based on two underlying metrics: the generational share of both S&P 500 CEOs and small business owners. This enabled us to capture data from two sides of the business spectrum to see who holds power there. Download the Generational Power Report (.pdf)
Shifting Dynamics in Economic Power
America’s wealth distribution is not stagnant, meaning the balance of economic power shifts with each passing year. Keeping this in mind, here are two of the most compelling trends that we discovered while analyzing data for the GPI report.
1. Younger Generations Show Sluggish Growth
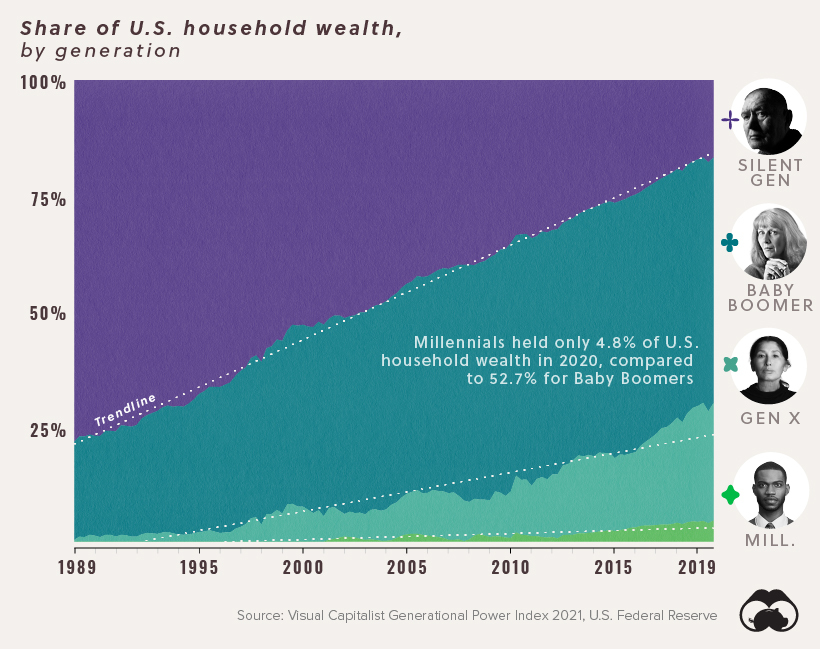
The following chart illustrates each generation’s share of household wealth over time.
It makes sense that Baby Boomers would hold the most wealth of any generation. They have had more time to accumulate assets, and the population of Boomers is roughly three times higher than that of the Silent Generation. What’s more interesting, however, is the stark difference in wealth trajectories between Boomers and younger generations. While Boomers entered the workforce in a prosperous post-WWII era, Millennials and Gen Z have either started their careers in the aftermath of the 2008 Financial Crisis, or in the midst of the COVID-19 pandemic. To put it in perspective, when Baby Boomers were as old as today’s Millennials in 1989, they held 21.3% of U.S. wealth. That’s more than four times higher than what Millennials hold now.
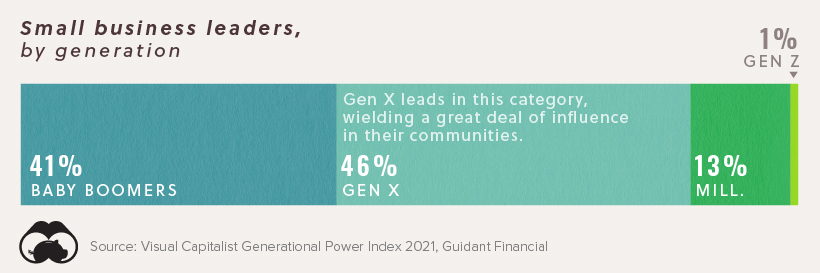
2. Small Business: The 99.9%
In fact, small businesses make up 99.9% of all U.S. companies, and employ one-third of the nation’s workforce. Here is who runs small businesses, from a generational perspective:
The 13% share held by Millennials may not sound too impressive, but it is one of the cohort’s strongest areas for economic power. Looking forward, it seems entrepreneurship will grow into an area of strength for both Millennials and Gen Z, who are 188% more likely to want to create a side business compared to older generations. Combine this with the fact that e-commerce adoption has been accelerating even faster than expected due to the pandemic, and it’s easy to see how younger, more tech-savvy generations could quickly expand their influence.