As global GDP has grown over the last four decades, from $23.6 trillion in 1990 to $84.5 trillion in 2020, the proportional share of the world’s top companies by market capitalization has grown over five-fold. Though the world’s top 50 companies change year-to-year, there’s also a lot of overlap.
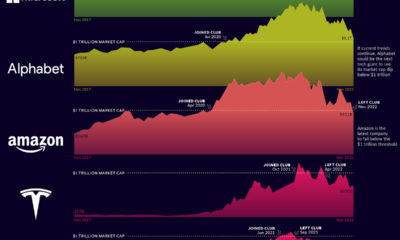
Which Companies Dominated Each Decade?
2020’s largest company by market cap, Apple at $2.26 trillion, was the third largest company in 2010. Likewise, 2010’s largest company was Exxon Mobil, which was the second largest company in both 1990 and 2000 (but has since fallen off). The top 50 companies in the world also highlight the increasing role of tech in the modern market. 1990’s largest company IBM was just one of three tech companies that made the ranking that year. Even in 2000, when the world’s largest company was GE, tech companies like Cisco and Microsoft only made up three of the top 10 companies by market cap. Fast forward to 2020, and tech accounted for 42% of the top 50 companies in the world. It also plays a more prominent role on the high end of the spectrum, as six of 2020’s seven largest companies were tech-based, with only oil giant Saudi Aramco the odd one out. Though digitization is a primary driver of current economic growth, will these trends remain steady in 10 or more years from now? Or will companies from other booming industries such as green energy take over the leaderboard?
Like this? You might find this article interesting, 23 Years of Shifting Tech Market Caps Source: Bloomberg, IMF. on Today’s connected cars come stocked with as many as 200 onboard sensors, tracking everything from engine temperature to seatbelt status. And all those sensors create reams of data, which will increase exponentially as the autonomous driving revolution gathers pace. With carmakers planning on uploading 50-70% of that data, this has serious implications for policymakers, manufacturers, and local network infrastructure. In this visualization from our sponsor Global X ETFs, we ask the question: will connected cars break the internet?
Data is a Plural Noun
Just how much data could it possibly be? There are lots of estimates out there, from as much as 450 TB per day for robotaxis, to as little as 0.383 TB per hour for a minimally connected car. This visualization adds up the outputs from sensors found in a typical connected car of the future, with at least some self-driving capabilities. The focus is on the kinds of sensors that an automated vehicle might use, because these are the data hogs. Sensors like the one that turns on your check-oil-light probably doesn’t produce that much data. But a 4K camera at 30 frames a second, on the other hand, produces 5.4 TB per hour. All together, you could have somewhere between 1.4 TB and 19 TB per hour. Given that U.S. drivers spend 17,600 minutes driving per year, a vehicle could produce between 380 and 5,100 TB every year. To put that upper range into perspective, the largest commercially available computer storage—the 100 TB SSD Exadrive from Nimbus—would be full in 5 hours. A standard Blu-ray disc (50 GB) would be full in under 2 seconds.
Lag is a Drag
The problem is twofold. In the first place, the internet is better at downloading than uploading. And this makes sense when you think about it. How often are you uploading a video, versus downloading or streaming one? Average global mobile download speeds were 30.78 MB/s in July 2022, against 8.55 MB/s for uploads. Fixed broadband is much higher of course, but no one is suggesting that you connect really, really long network cables to moving vehicles.
Ultimately, there isn’t enough bandwidth to go around. Consider the types of data traffic that a connected car could produce:
Vehicle-to-vehicle (V2V) Vehicle-to-grid (V2G) Vehicles-to-people (V2P) Vehicles-to-infrastructure (V2I) Vehicles-to-everything (V2E)
The network just won’t be able to handle it.
Moreover, lag needs to be relatively non-existent for roads to be safe. If a traffic camera detects that another car has run a red light and is about to t-bone you, that message needs to get to you right now, not in a few seconds.
Full to the Gunwales
The second problem is storage. Just where is all this data supposed to go? In 2021, total global data storage capacity was 8 zettabytes (ZB) and is set to double to 16 ZB by 2025.
One study predicted that connected cars could be producing up to 10 exabytes per month, a thousand-fold increase over current data volumes.
At that rate, 8 ZB will be full in 2.2 years, which seems like a long time until you consider that we still need a place to put the rest of our data too.
At the Bleeding Edge
Fortunately, not all of that data needs to be uploaded. As already noted, automakers are only interested in uploading some of that. Also, privacy legislation in some jurisdictions may not allow highly personal data, like a car’s exact location, to be shared with manufacturers.
Uploading could also move to off-peak hours to even out demand on network infrastructure. Plug in your EV at the end of the day to charge, and upload data in the evening, when network traffic is down. This would be good for maintenance logs, but less useful for the kind of real-time data discussed above.
For that, Edge Computing could hold the answer. The Automotive Edge Computing Consortium has a plan for a next generation network based on distributed computing on localized networks. Storage and computing resources stay closer to the data source—the connected car—to improve response times and reduce bandwidth loads.
Invest in the Future of Road Transport
By 2030, 95% of new vehicles sold will be connected vehicles, up from 50% today, and companies are racing to meet the challenge, creating investing opportunities.
Learn more about the Global X Autonomous & Electric Vehicles ETF (DRIV). It provides exposure to companies involved in the development of autonomous vehicles, EVs, and EV components and materials.
And be sure to read about how experiential technologies like Edge Computing are driving change in road transport in Charting Disruption. This joint report by Global X ETFs and the Wall Street Journal is also available as a downloadable PDF.