Used by millions of people to get to work, transport goods, and travel, the modern automobile has become ubiquitous in our daily lives. So much so, that a whopping 92 million cars were produced in just 2019. To help us understand the might of the auto industry, this infographic from Parts Geek breaks down the earnings of 19 major car companies by an interesting metric—revenue per second.
The Full List of Automakers
Below are the earnings of the 19 automakers featured in the infographic. The Volkswagen Group claims the top spot with $290.2B in gross revenue, translating to $9,202.88 per second. Capping off the list is the world’s most valuable automaker, Tesla, which generated a relatively smaller $24.6B in gross revenue, or $780.06 per second. A clear takeaway from this data is that Volkswagen and Toyota have a sizable lead over the rest of their peers. Let’s take a closer look at how these two companies operate.
The Volkswagen Group
The Volkswagen Group holds a comprehensive portfolio of brands and services, and has been the world’s largest automaker, by sales, for the past three years. Beginning with passenger cars and motorcycles, its numerous brands reported the following results for 2019. *Based on an exchange rate of 1.12 EUR/USD (Dec. 31, 2019) Source: Volkswagen Other sources of revenue were Volkswagen’s $44.5B commercial vehicle business, its $4.7B power engineering business, and lastly its $44.4B financial services division. In total, the Volkswagen Group delivered just short of 11 million vehicles in 2019, besting its 2018 deliveries by 1.3% and setting a new record for the group. While a majority of these vehicles were produced in Europe, the group operates a global production network with a significant presence in Asia. Source: Volkswagen The German automaker has invested billions in China, the world’s largest car market, to scale its electric vehicle (EV) production capabilities.
Toyota Motor Corporation
Toyota Motor Corporation operates a much more concentrated brand portfolio, with Toyota and Lexus being its two most prominent names. This strategy seems to be working well, as Toyota was ranked the ninth most valuable brand in 2019, and was the only automaker to crack the top ten. A testament to Toyota’s global influence is its relatively balanced breakdown of 2019 revenues by regional market:
North America: 30% Japan: 25% Asia: 18% Europe: 11.5% Other: 15.3%
For comparison, here is Volkswagen’s 2019 revenues by region, which leans heavily towards Europe:
Europe (excl. Germany): 42% Germany: 19% North America: 17% South America: 4% Asia-Pacific: 17%
The Japanese automaker’s popularity in foreign regions is likely the result of its reputation for reliability and affordability. It may also explain why Toyota’s trucks are a common sight in tough environments such as conflict zones of the developing world. Altogether, Toyota and its subsidiaries sold nearly 9 million vehicles in 2019, setting a new record for the company but just 0.1% higher than its 2018 figure. Similar to Volkswagen, a majority of Toyota’s vehicles are produced in its home region, with the remainder being built around the world. Source: Toyota Outside of Japan, Toyota has significant production capabilities in the U.S., where it makes everything from pickup trucks to sedans. In 2016, the Toyota Camry made headlines after being ranked the most American-made car—over 75% of its parts were sourced domestically.
Alternative Revenue Sources
While automobiles represent the core business for these companies, many of them have alternative revenue sources. Honda, for example, produces motorcycles, boat engines, lawn mowers, and even personal jets. Porsche takes a slightly different approach with its accessories and licensing subsidiary, Porsche Design. Since 2003, a variety of lifestyle goods including eyewear, smartphones, and watches have been sold under the Porsche name. Its most noteworthy project is the Porsche Design Tower Miami, a residential skyscraper which features a robotic car elevator. Finally, electric vehicle (EV) maker Tesla earns additional revenues by selling carbon credits to other automakers that fail to meet government-imposed quotas on EV sales. Since Tesla only produces EVs, it has no need for its credits and is free to sell them. In the second quarter of 2020, Tesla earned $428 million from selling carbon credits, representing 7% of its total revenues for the period.
The Road Ahead
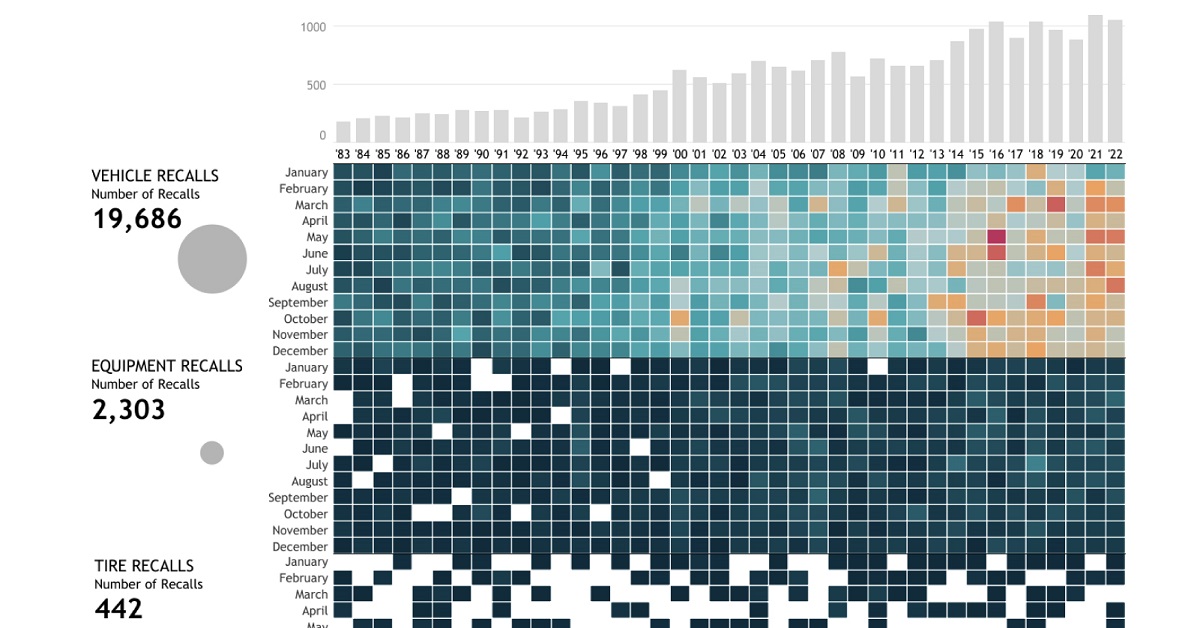
Additional revenue streams are continuing to open up as automakers integrate new technologies into their cars. Cadillac and Tesla, two American brands, have both announced that their self-driving capabilities will eventually become a paid subscription service. Meanwhile, Germany’s premium automakers are expanding into wireless services. BMW claims it will become the first automaker to offer 5G connectivity in its cars, while Mercedes now sells downloadable software packages to enhance a driver’s experience. While it’s too early to say whether or not these services will have a significant impact on an automaker’s bottom line, forecasts claim this so-called “connected car market” will be worth $166 billion by 2025. To put that into perspective, that’s more than half of Volkswagen’s gross revenue in 2019, or $5,264 per second. on These faulty airbags, installed by 19 different automakers including BMW and Toyota from 2002 to 2015, can explode when deployed and have led to numerous tragic accidents. Their recall affected 67 million airbags (including Honda’s vehicles above) and has been known as the largest safety recall in U.S. history. Over the past four decades, there have been over 22,000 automobile recalls in the United States. In this interactive piece, Chimdi Nwosu uses data from the National Highway Traffic Safety Administration to visualize the types of automobile recalls over the past 40 years, the companies with the most recalls, the components that were recalled the most, and, most importantly, their impacts on people.
Breaking Down U.S. Automobile Recalls
Whether a recall affects specific vehicle components, equipment, or vehicles as a whole, it affects the lives of millions of automobile users. When combined, these numbers ramp up exponentially. The U.S. alone has seen a total of 22,651 recalls over the past 40 years, impacting more than one billion people. Almost 72% of these people were affected by nearly 20,000 vehicle recalls, while around 19% were impacted by over 2,000 equipment recalls during this period. Comparatively, the 442 tire recalls and 220 child seat recalls affected significantly less, but still a total of 96.9 million people. While an inconvenience to many, the recall of these faulty vehicle parts saves many more from unfortunate incidents that may have occurred if left unchecked.
Minor and Major Recalls
One of the largest recalls in history took place in 2014 when General Motors—the manufacturer with the highest total of recalls in four decades—recalled millions of vehicles including the 2005-2007 Chevrolet Cobalt, 2007 Pontiac G5, and 2006-2007 Chevrolet HHR, amongst others. The reason for this recall was a faulty ignition switch that caused the vehicle’s engine to shut down while driving, disabling safety systems including airbags. This fault led to the death of hundreds of people. However, not all recalls are this severe. BMW, for example, recalled just four vehicles in December last year because one of the four bolts in the driver’s backrest was not attached properly. Similarly in 2020, Ford recalled some of its vehicles due to a faulty door latch. While this recall inconvenienced over two million users, it was less likely to lead to severe consequences if left unchecked.
A Safer Future?
The number of automobile recalls over the past four decades has seen a steep rise. As have car safety standards. While recalls could hint at the risks involved in taking your car out for a drive, they also indicate manufacturers taking responsibility for their faulty commodities, and affect a very small percentage of vehicles on the road. To improve automobile safety, the NHTSA proposed a New Car Assessment Program in 2022, which provides vehicle users with safety ratings for every new vehicle. This five-star safety rating program rates the vehicles’ safety features, crashworthiness, and resistance to rollover. With self-driving cars now also entering the mix, we need to stay informed about vehicle safety to keep our vehicles, our streets, and ourselves safe in the future.