The U.S.’ Trinity test in 1945, the first-ever nuclear detonation, released around 19 kilotons of explosive energy. The explosion instantly vaporized the tower it stood on and turned the surrounding sand into green glass, before sending a powerful heatwave across the desert. As the Cold War escalated in the years after WWII, the U.S. and the Soviet Union tested bombs that were at least 500 times greater in explosive power. This infographic visually compares the 10 largest nuclear explosions in history.
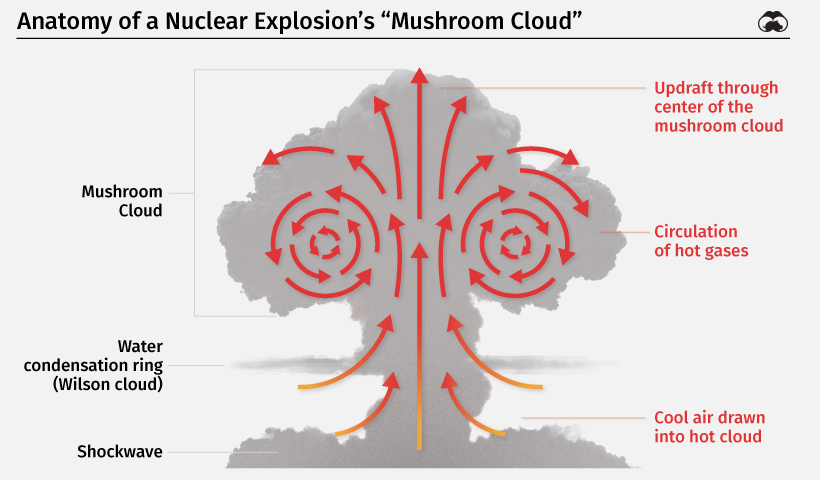
The Anatomy of a Nuclear Explosion
After exploding, nuclear bombs create giant fireballs that generate a blinding flash and a searing heatwave. The fireball engulfs the surrounding air, getting larger as it rises like a hot air balloon. As the fireball and heated air rise, they are flattened by cooler, denser air high up in the atmosphere, creating the mushroom “cap” structure. At the base of the cloud, the fireball causes physical destruction by sending a shockwave moving outwards at thousands of miles an hour.
A strong updraft of air and dirt particles through the center of the cloud forms the “stem” of the mushroom cloud. In most atomic explosions, changing atmospheric pressure and water condensation create rings that surround the cloud, also known as Wilson clouds. Over time, the mushroom cloud dissipates. However, it leaves behind radioactive fallout in the form of nuclear particles, debris, dust, and ash, causing lasting damage to the local environment. Because the particles are lightweight, global wind patterns often distribute them far beyond the place of detonation. With this context in mind, here’s a look at the 10 largest nuclear explosions.
#10: Ivy Mike (1952)
In 1952, the U.S. detonated the Mike device—the first-ever hydrogen bomb—as part of Operation Ivy. Hydrogen bombs rely on nuclear fusion to amplify their explosions, producing much more explosive energy than atomic bombs that use nuclear fission. Weighing 140,000 pounds (63,500kg), the Ivy Mike test generated a yield of 10,400 kilotons, equivalent to the explosive power of 10.4 million tons of TNT. The explosion was 700 times more powerful than Little Boy, the bomb dropped on Hiroshima in 1945.
#9: Castle Romeo (1954)
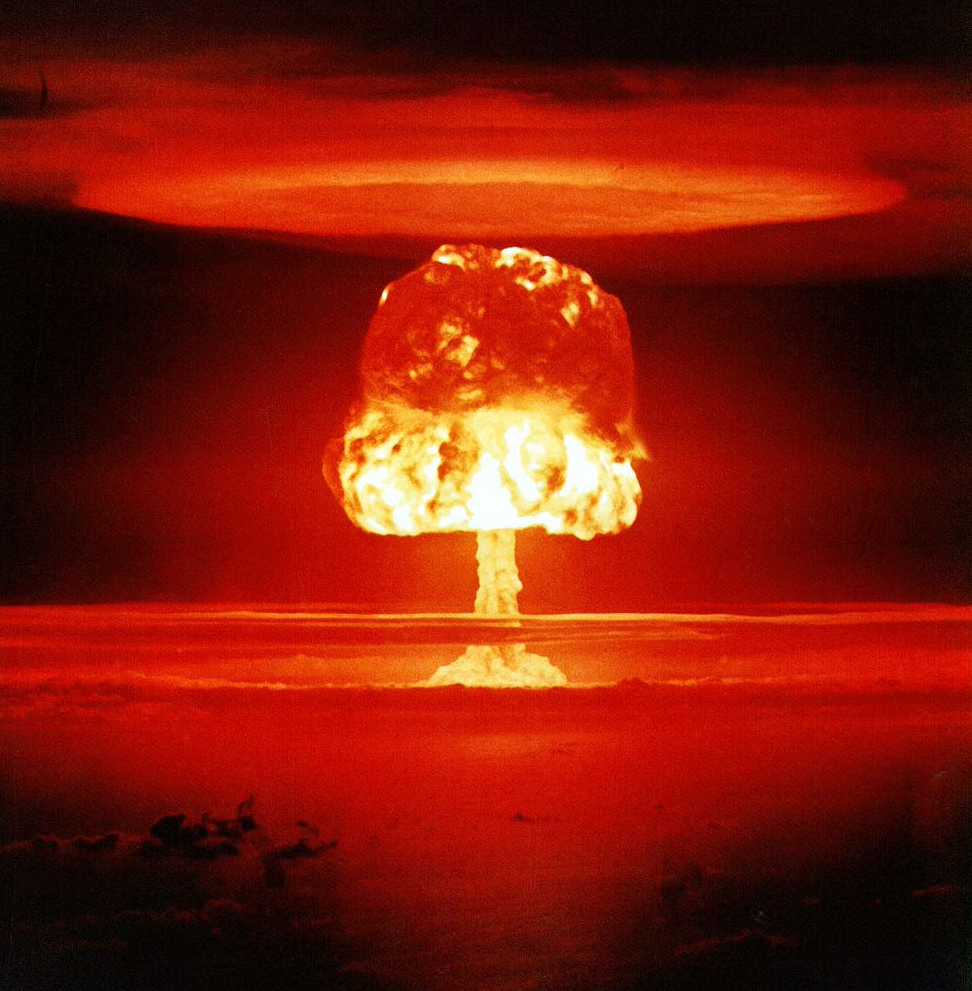
Castle Romeo was part of the Operation Castle series of U.S. nuclear tests taking place on the Marshall Islands. Shockingly, the U.S. was running out of islands to conduct tests, making Romeo the first-ever test conducted on a barge in the ocean. At 11,000 kilotons, the test produced more than double its predicted explosive energy of 4,000 kilotons. Its fireball, as seen below, is one of the most iconic images ever captured of a nuclear explosion.
#8: Soviet Test #123 (1961)
Test #123 was one of the 57 tests conducted by the Soviet Union in 1961. Most of these tests were conducted on the Novaya Zemlya archipelago in Northwestern Russia. The bomb yielded 12,500 kilotons of explosive energy, enough to vaporize everything within a 2.1 mile (3.5km) radius.
#7: Castle Yankee (1954)
Castle Yankee was the fifth test in Operation Castle. The explosion marked the second-most powerful nuclear test by the U.S. It yielded 13,500 kilotons, much higher than the predicted yield of up to 10,000 kilotons. Within four days of the blast, its fallout reached Mexico City, roughly 7,100 miles (11,400km) away.
#6: Castle Bravo (1954)
Castle Bravo, the first of the Castle Operation series, accidentally became the most powerful nuclear bomb tested by the U.S. Due to a design error, the explosive energy from the bomb reached 15,000 kilotons, two and a half times what was expected. The mushroom cloud climbed up to roughly 25 miles (40km). As a result of the test, an area of 7,000 square miles was contaminated, and inhabitants of nearby atolls were exposed to high levels of radioactive fallout. Traces of the blast were found in Australia, India, Japan, and Europe.
#5, #4, #3: Soviet Tests #173, #174, #147 (1962)
In 1962, the Soviet Union conducted 78 nuclear tests, three of which produced the fifth, fourth, and third-most powerful explosions in history. Tests #173, #174, and #147 each yielded around 20,000 kilotons. Due to the absolute secrecy of these tests, no photos or videos have been released.
#2: Soviet Test #219 (1962)
Test #219 was an atmospheric nuclear test carried out using an intercontinental ballistic missile (ICBM), with the bomb exploding at a height of 2.3 miles (3.8km) above sea level. It was the second-most powerful nuclear explosion, with a yield of 24,200 kilotons and a destructive radius of ~25 miles (41km).
#1: Tsar Bomba (1961)
Tsar Bomba, also called Big Ivan, needed a specially designed plane because it was too heavy to carry on conventional aircraft. The bomb was attached to a giant parachute to give the plane time to fly away. The explosion, yielding 50,000 kilotons, obliterated an abandoned village 34 miles (55km) away and generated a 5.0-5.25 magnitude earthquake in the surrounding region. Initially, it was designed as a 100,000 kiloton bomb, but its yield was cut to half its potential by the Soviet Union. Tsar Bomba’s mushroom cloud breached through the stratosphere to reach a height of over 37 miles (60km), roughly six times the flying height of commercial aircraft. The two bombs dropped on Hiroshima and Nagasaki had devastating consequences, and their explosive yields were only a fraction of the 10 largest explosions. The power of modern nuclear weapons makes their scale of destruction truly unfathomable, and as history suggests, the outcomes can be unpredictable. on Cities—settlements that are densely populated and self-administered—require many specific prerequisites to come into existence. The most crucial, especially for much of human history, is an abundance of food. Surplus food production leads to denser populations and allows for people to specialize in other skills that are not associated with basic human survival. But that also means that cities usually consume more primary goods than they produce. And their size requires a host of many other services—such as transport and sanitation—that are traditionally expensive to maintain. So maintaining large urban centers, and especially the world’s largest cities, was a monumental task. Mapper and history YouTuber Ollie Bye has visualized the seven largest cities in the world since 3,000 BCE. His video covers cities with a minimum population of 10,000 and hints at historical events which led to the establishment, growth, and eventual fall of cities.
The World’s Largest City Throughout History
With any historical data, accuracy is always a concern, and urban populations were rough and infrequent estimates up until the Industrial Revolution. Bye has used a variety of data sources—including the UN and many research papers—to create the dataset used in the video. In some places he also had to rely on his own estimates and criteria to keep the data reasonable and consistent:
In early history, some cities didn’t have given population estimates for long periods of time, and had to be equalized or estimated through other sources. For example, Babylon had a population estimate at 1,600 BCE (60,000) and at 1,200 BCE (75,000) but none in the 400 years between. Cities that only briefly climbed above a population of 10,000, or that would have made the largest cities ranking for only a couple of years (and based on uncertain estimates), were not included.
Here’s a look at the largest city starting from the year 3,000 BCE, with populations listed in millions during the last year of each city’s “reign.” Cities are also listed with the flags of current-day countries in the same location.
Ancient Cities in the Fertile Crescent
Considered the “cradle of civilization,” the Fertile Crescent in the Middle East was home to all seven of the largest cities in the world in 3,000 BCE. The Sumerian city of Uruk (modern-day Iraq), allegedly home to the legendary king Gilgamesh, topped the list with 40,000 people. It was followed by Memphis (Egypt) with 20,000 inhabitants. For the next 1,700 years, other Mesopotamian cities in modern-day Iraq and Syria held pole positions, growing steadily and shuffling between themselves as the largest. 2,250 BCE marked the first time a different Asian city—Mohenjo-Daro (modern-day Pakistan) from the Indus Valley Civilization—found a spot at #4 with 40,000 people. The table below is a quick snapshot of the seven largest cities in the world for from 3,000 BCE to 200 CE. Again, populations are listed in millions. It wasn’t until 1,250 BCE that the top two spots were taken by cities in different regions: Pi-Ramesses (Egypt) and Yin (China), both with more than 100,000 residents. Egyptian cities would continue to be the most populous for the next millennium—briefly interrupted by Carthage and Babylon—until the start of the Common Era. By 30 CE, Alexandria was the largest city in the world, but the top 10 had representatives from the Middle East, Northern Africa, and Asia.
All Roads Lead to Rome
One city in Europe meanwhile, was also beginning to see steady growth—Rome. It took until halfway through the 3rd century C.E. for Rome to become the most populous city, followed closely still by Alexandria (Egypt). Meanwhile in Iraq, Ctesiphon, the capital of the Sasanian empire was growing rapidly. Towards the end of the 3rd century, the Roman empire was divided into two, with Constantinople becoming the new capital for the Eastern half. Consequently, it had outgrown Rome by 353 and become the world’s most populous city, and for the next few centuries would reclaim this title time and time again.
The Largest Cities Reach 1 Million
In the 9th century, Baghdad became the first city to have 1 million residents (though historians also estimate Rome and the Chinese city of Chang’an may have achieved that figure earlier). It would be nearly nine centuries until a city had one million inhabitants again, and Baghdad’s reign didn’t last long. By the 10th century, Bian, the capital of the Northern Song dynasty in China, had become the largest city in the world, with Baghdad suffering from relocations and shifting political power to other cities in the region. From the 12th century onwards, Mongol invasions in the Middle East and Central Asia severely limited population growth in the region. European cities too were ravaged in the 14th century, but by plagues instead of marauders. For the next few hundred years, Cairo (Egypt), Hangzhou (China), and Vijayanagara (India) would top the list until Beijing took (and mostly held onto) the top spot through the 19th century.
Industrial Revolution and Rapid Urbanization
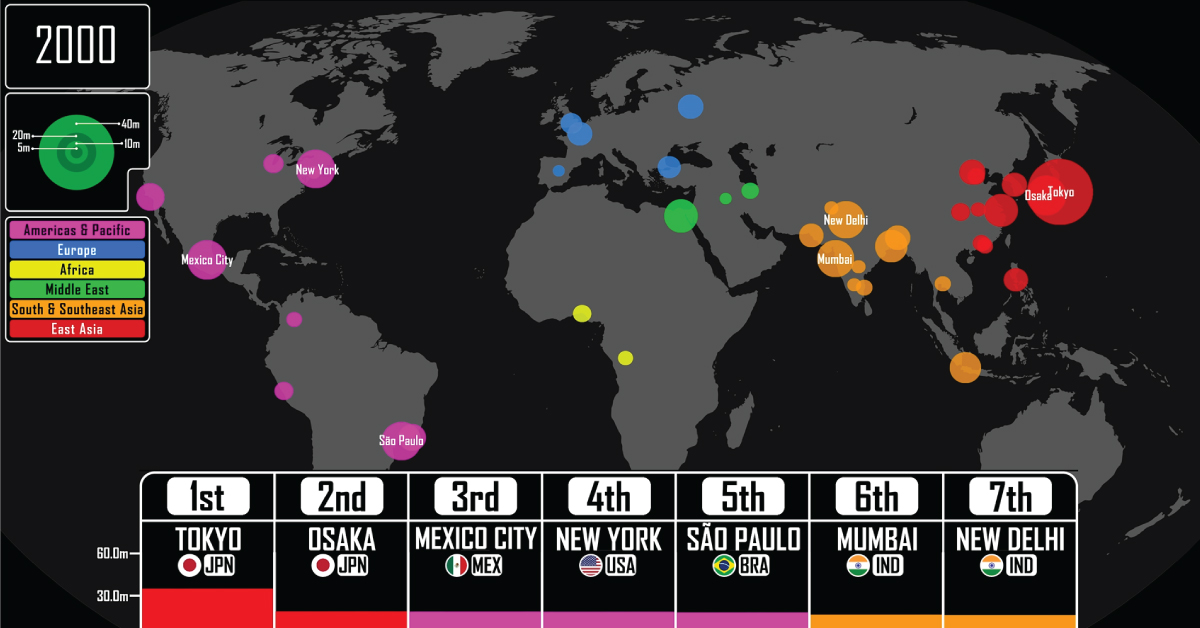
The start of the Industrial Revolution in the UK—spreading to the rest of Europe and later on the U.S.—led to hitherto unseen levels of urban population growth. Factories needed labor, which caused mass emigration from the rural countryside to urban centers of growth. In 1827, London passed Beijing to become the largest city in the world with 1.3 million residents. Over the next 100 years, its population increased nearly 7 times, remaining the most populous city until the end of World War I, by which time it was overtaken by New York. From 1920 to 2022, the world population quadrupled thanks to improvements in farming and healthcare, and cities saw rapid growth as well. The beginning of the 20st century saw the top 10 largest cities in the world in the U.S., Europe, and Japan. By the 21st century however, growth shifted away to other parts of the world and by 2021, the top seven had cities only from Asia and the Americas. Tokyo, which took the top spot in 1954, is the largest city in the world today with a population of 37 million (including the entire metropolitan area). It is followed by New Delhi with 31 million, but by 2028, the UN estimates that positions will switch on the leaderboard and New Delhi will overtake Tokyo.
What Does Population Growth Say About the Past (and Future)?
The rise and fall of cities through the sands of time can give us insight into the trajectory of civilization growth. As civilizations grow, become richer, and reach their zenith, so too do their cities blossom in tandem. For example, of the modern-day seven largest cities in the world, four of them belong to countries with the 10 largest economies in the world. Meanwhile, sudden falls in urban population point to turbulence—political instability, wars, natural disasters, or disease. Most recently Ukraine’s cities are seeing depopulation as residents flee conflict zones, raising the specter of a demographic crisis for the country should the war continue. Thus, tracking the size of urban population can help policymakers forecast future roadblocks to growth, especially when prioritizing sustainable growth for a country.