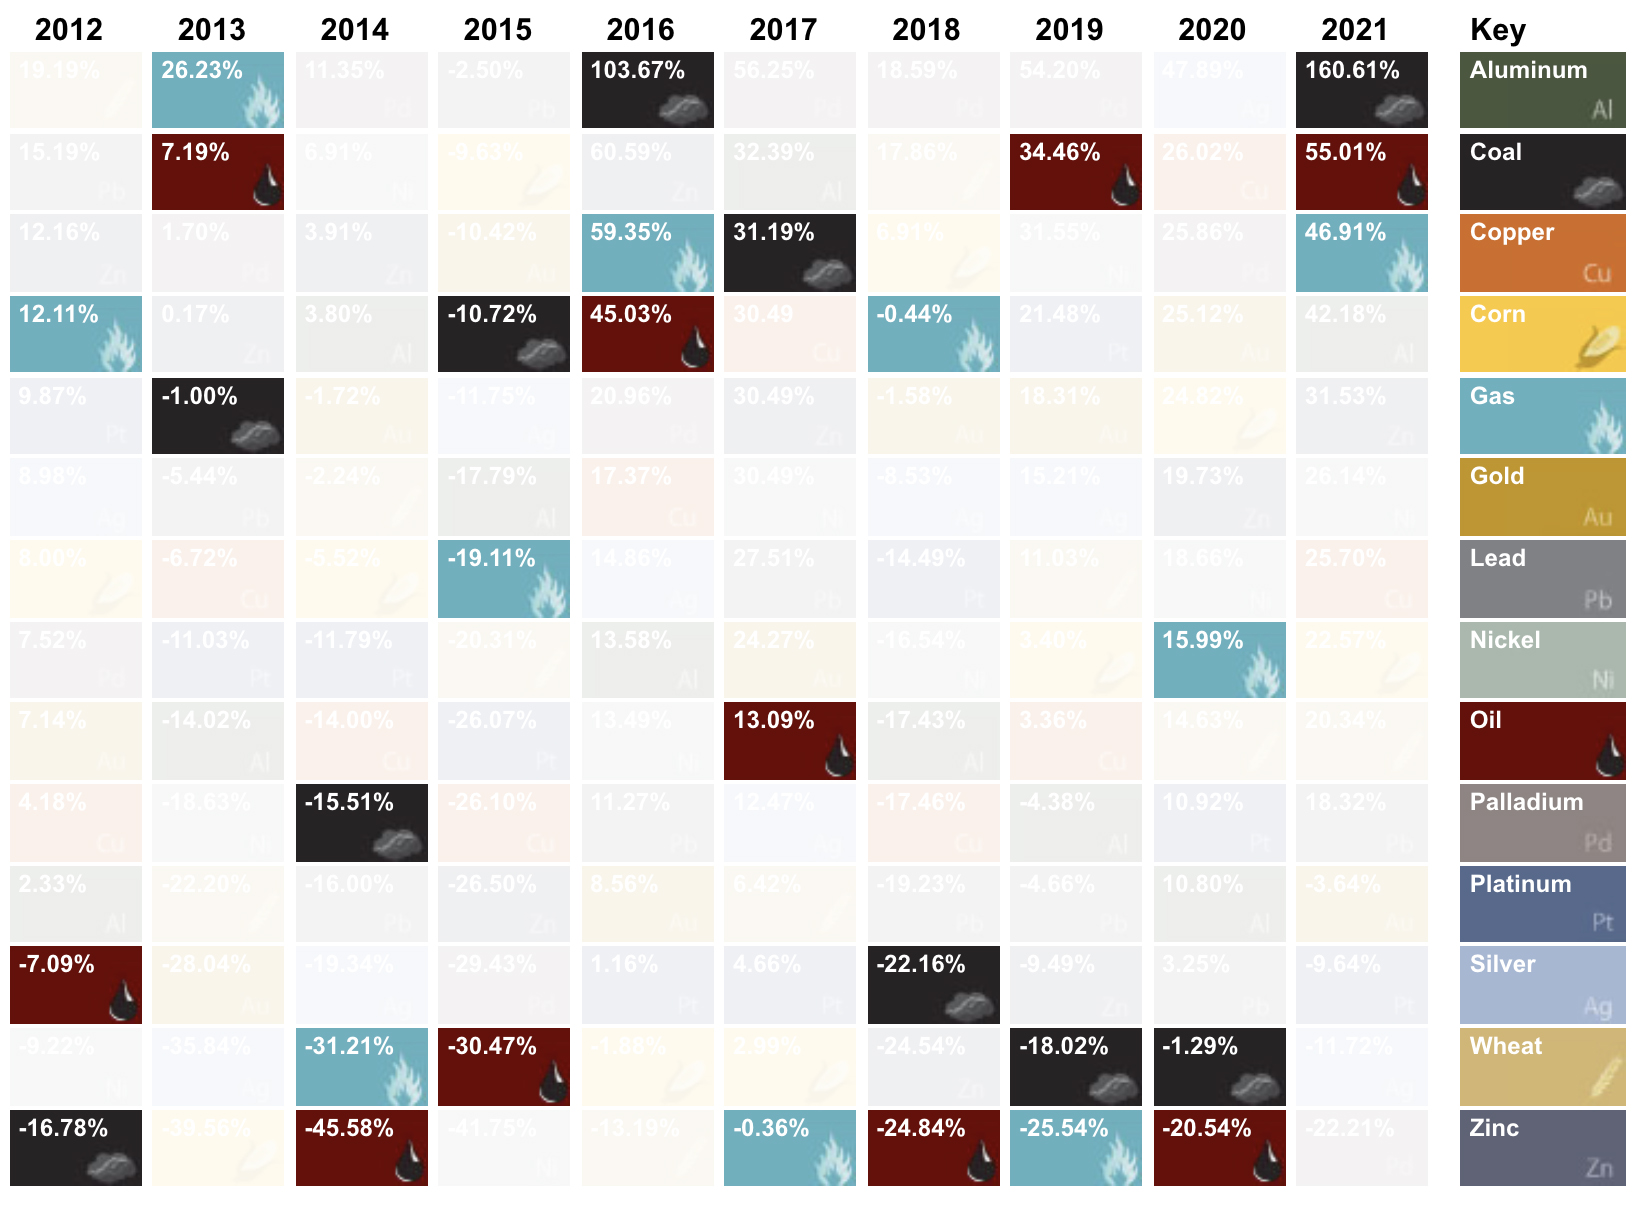
The S&P Goldman Sachs Commodity Index (GSCI) was the third best-performing asset class in 2021, returning 37.1% and beating out real estate and all major equity indices. This graphic from U.S. Global Investors tracks individual commodity returns over the past decade, ranking them based on their individual performance each year.
Commodity Prices Surge in 2021
After a strong performance from commodities (metals especially) in the year prior, 2021 was all about energy commodities. The top three performers for 2021 were energy fuels, with coal providing the single best annual return of any commodity over the past 10 years at 160.6%. According to U.S. Global Investors, coal was also the least volatile commodity of 2021, meaning investors had a smooth ride as the fossil fuel surged in price. Source: U.S. Global Investors The only commodities in the red this year were precious metals, which failed to stay positive despite rising inflation across goods and asset prices. Gold and silver had returns of -3.6% and -11.7% respectively, with platinum returning -9.6% and palladium, the worst performing commodity of 2021, at -22.2%. Aside from the precious metals, every other commodity managed double-digit positive returns, with four commodities (crude oil, coal, aluminum, and wheat) having their best single-year performances of the past decade.
Energy Commodities Outperform as the World Reopens
The partial resumption of travel and the reopening of businesses in 2021 were both powerful catalysts that fueled the price rise of energy commodities. After crude oil’s dip into negative prices in April 2020, black gold had a strong comeback in 2021 as it returned 55.01% while being the most volatile commodity of the year. Natural gas prices also rose significantly (46.91%), with the UK and Europe’s natural gas prices rising even more as supply constraints came up against the winter demand surge.
Despite being the second worst performer of 2020 with the clean energy transition on the horizon, coal was 2021’s best commodity. High electricity demand saw coal return in style, especially in China which accounts for one-third of global coal consumption.
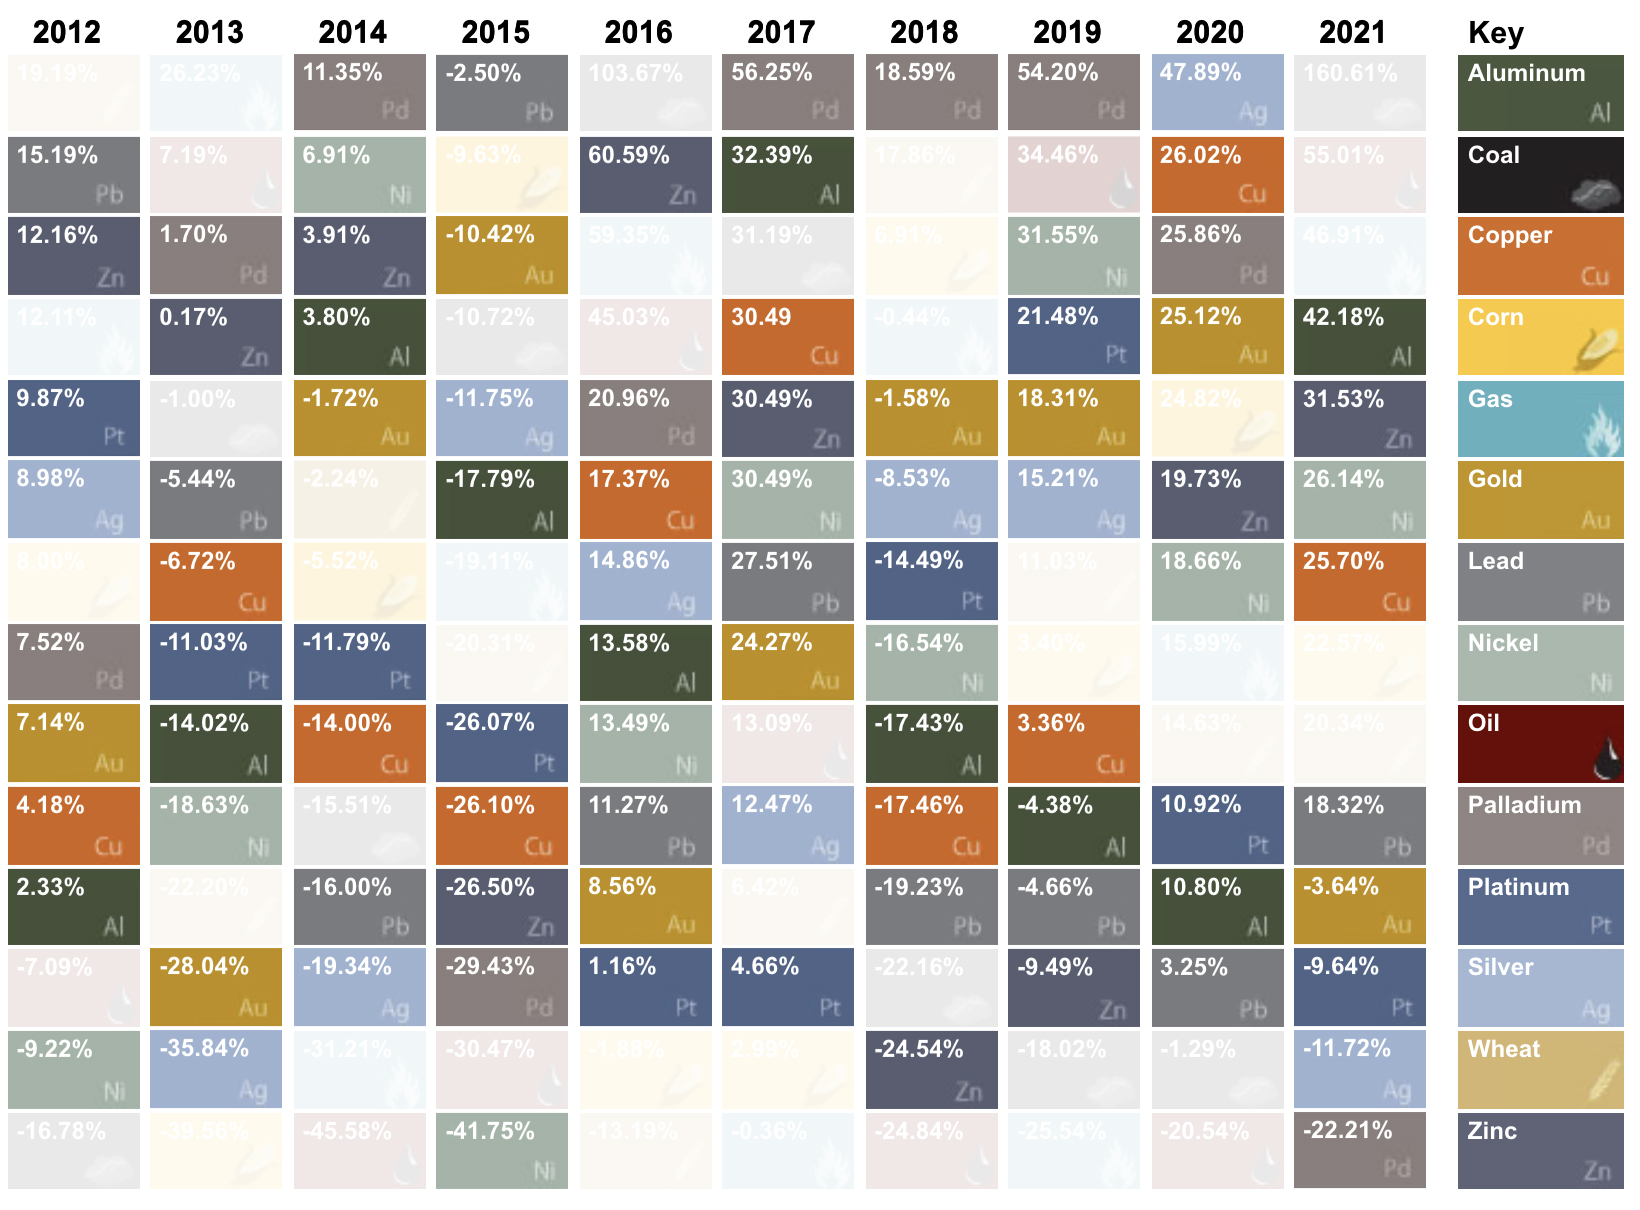
Base Metals Beat out Precious Metals
2021 was a tale of two metals, as precious metals and base metals had opposing returns. Copper, nickel, zinc, aluminum, and lead, all essential for the clean energy transition, kept up last year’s positive returns as the EV batteries and renewable energy technologies caught investors’ attention. Demand for these energy metals looks set to continue in 2022, with Tesla having already signed a $1.5 billion deal for 75,000 tonnes of nickel with Talon Metals.
On the other end of the spectrum, precious metals simply sunk like a rock last year. Investors turned to equities, real estate, and even cryptocurrencies to preserve and grow their investments, rather than the traditionally favorable gold (-3.64%) and silver (-11.72%). Platinum and palladium also lagged behind other commodities, only returning -9.64% and -22.21% respectively.
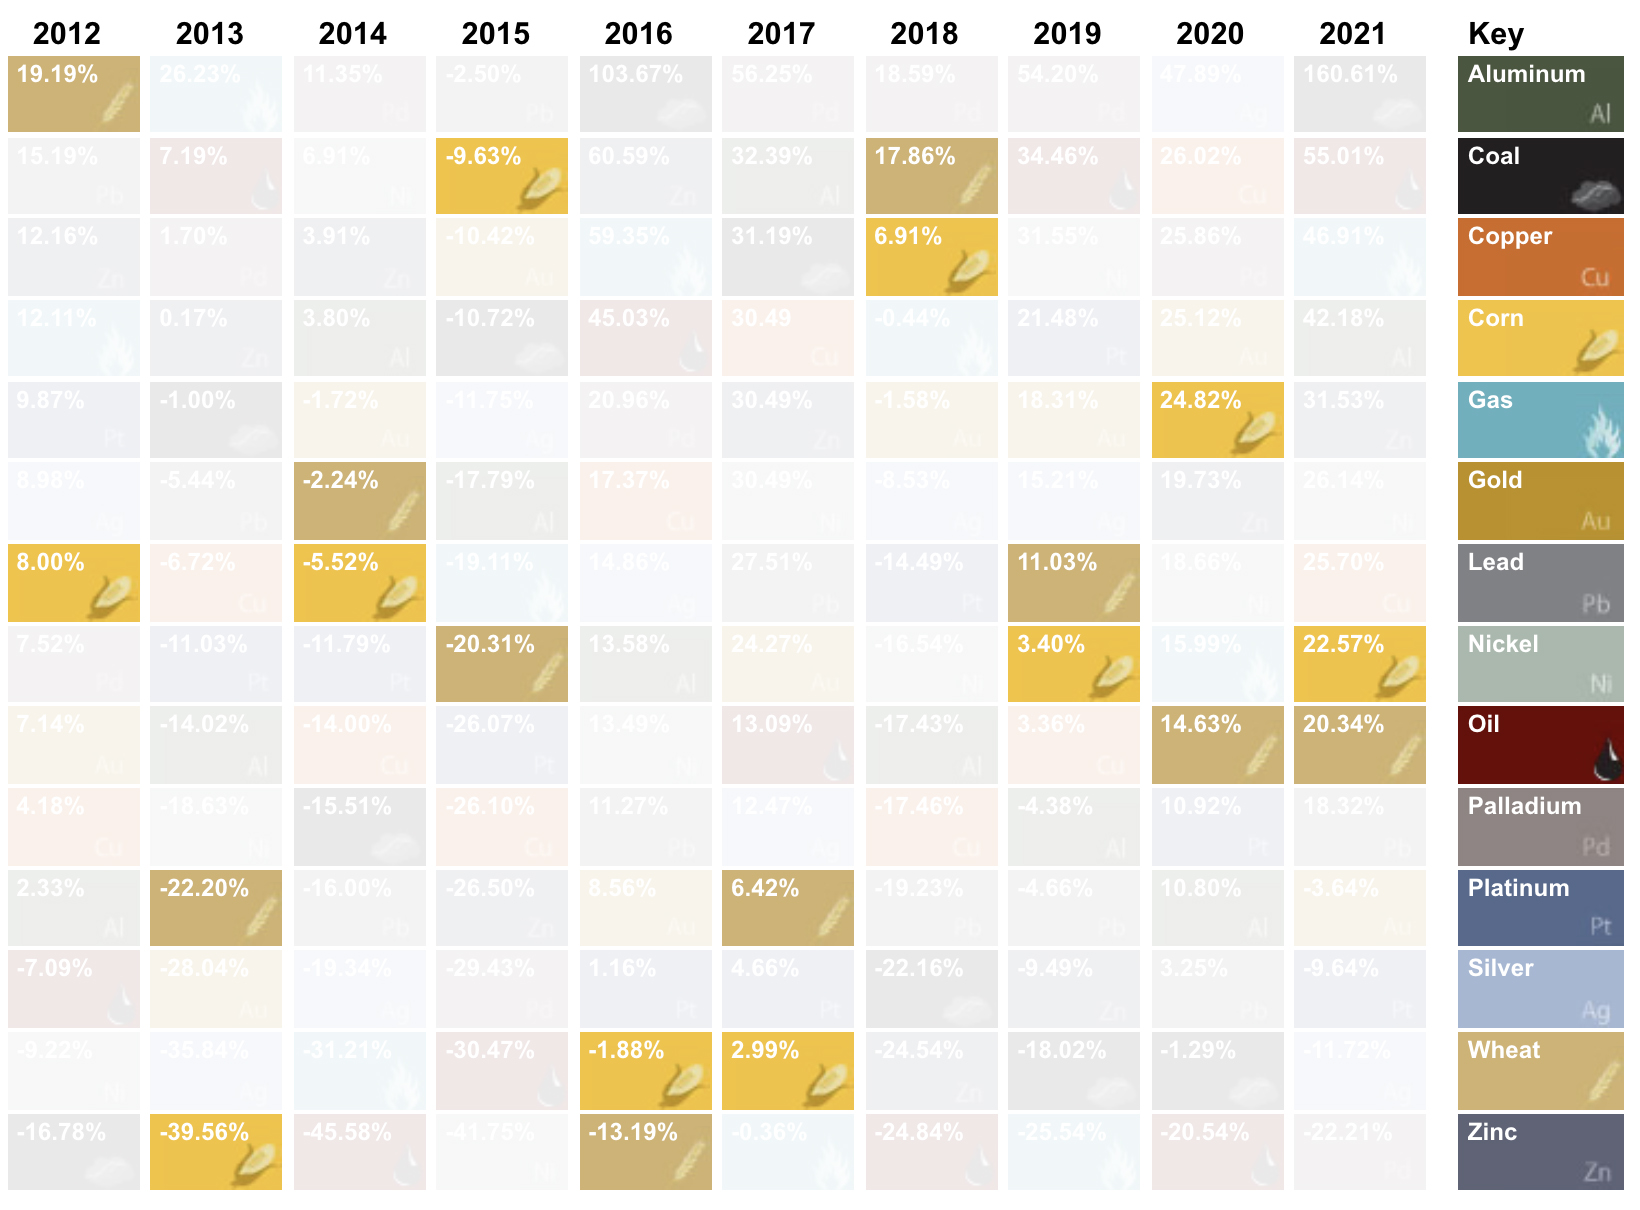
Grains Bring Steady Gains
In a year of over and underperformers, grains kept up their steady track record and notched their fifth year in a row of positive returns. Both corn and wheat provided double-digit returns, with corn reaching eight-year highs and wheat reaching prices not seen in over nine years. Overall, these two grains followed 2021’s trend of increasing food prices, as the UN Food and Agriculture Organization’s food price index reached a 10-year high, rising by 17.8% over the course of the year.
As inflation across commodities, assets, and consumer goods surged in 2021, investors will now be keeping a sharp eye for a pullback in 2022. We’ll have to wait and see whether or not the Fed’s plans to increase rates and taper asset purchases will manage to provide price stability in commodities. on
#1: High Reliability
Nuclear power plants run 24/7 and are the most reliable source of sustainable energy. Nuclear electricity generation remains steady around the clock throughout the day, week, and year. Meanwhile, daily solar generation peaks in the afternoon when electricity demand is usually lower, and wind generation depends on wind speeds.As the use of variable solar and wind power increases globally, nuclear offers a stable and reliable backbone for a clean electricity grid.
#2: Clean Electricity
Nuclear reactors use fission to generate electricity without any greenhouse gas (GHG) emissions.Consequently, nuclear power is the cleanest energy source on a lifecycle basis, measured in CO2-equivalent emissions per gigawatt-hour (GWh) of electricity produced by a power plant over its lifetime. The lifecycle emissions from a typical nuclear power plant are 273 times lower than coal and 163 times lower than natural gas. Furthermore, nuclear is relatively less resource-intensive, allowing for lower supply chain emissions than wind and solar plants.
#3: Stable Affordability
Although nuclear plants can be expensive to build, they are cost-competitive in the long run. Most nuclear plants have an initial lifetime of around 40 years, after which they can continue operating with approved lifetime extensions. Nuclear plants with lifetime extensions are the cheapest sources of electricity in the United States, and 88 of the country’s 92 reactors have received approvals for 20-year extensions. Additionally, according to the World Nuclear Association, nuclear plants are relatively less susceptible to fuel price volatility than natural gas plants, allowing for stable costs of electricity generation.
#4: Energy Efficiency
Nuclear’s high energy return on investment (EROI) exemplifies its exceptional efficiency. EROI measures how many units of energy are returned for every unit invested in building and running a power plant, over its lifetime. According to a 2018 study by Weissbach et al., nuclear’s EROI is 75 units, making it the most efficient energy source by some distance, with hydropower ranking second at 35 units.
#5: Sustainable Innovation
New, advanced reactor designs are bypassing many of the difficulties faced by traditional nuclear plants, making nuclear power more accessible.
Small Modular Reactors (SMRs) are much smaller than conventional reactors and are modular—meaning that their components can be transported and assembled in different locations. Microreactors are smaller than SMRs and are designed to provide electricity in remote and small market areas. They can also serve as backup power sources during emergencies.
These reactor designs offer several advantages, including lower initial capital costs, portability, and increased scalability.
A Nuclear-Powered Future
Nuclear power is making a remarkable comeback as countries work to achieve climate goals and ultimately, a state of energy utopia. Besides the 423 reactors in operation worldwide, another 56 reactors are under construction, and at least 69 more are planned for construction. Some nations, like Japan, have also reversed their attitudes toward nuclear power, embracing it as a clean and reliable energy source for the future. CanAlaska is a leading exploration company in the Athabasca Basin, the Earth’s richest uranium depository. Click here to learn more now. In part 3 of the Road to Energy Utopia series, we explore the unique properties of uranium, the fuel that powers nuclear reactors.