The Massive Impact of EVs on Commodities
How demand would change in a 100% EV world
The Chart of the Week is a weekly Visual Capitalist feature on Fridays. What would happen if you flipped a switch, and suddenly every new car that came off assembly lines was electric? It’s obviously a thought experiment, since right now EVs have close to just 1% market share worldwide. We’re still years away from EVs even hitting double-digit demand on a global basis, and the entire supply chain is built around the internal combustion engine, anyways. At the same time, however, the scenario is interesting to consider. One recent projection, for example, put EVs at a 16% penetration by 2030 and then 51% by 2040. This could be conservative depending on the changing regulatory environment for manufacturers – after all, big markets like China, France, and the U.K. have recently announced that they plan on banning gas-powered vehicles in the near future.
The Thought Experiment
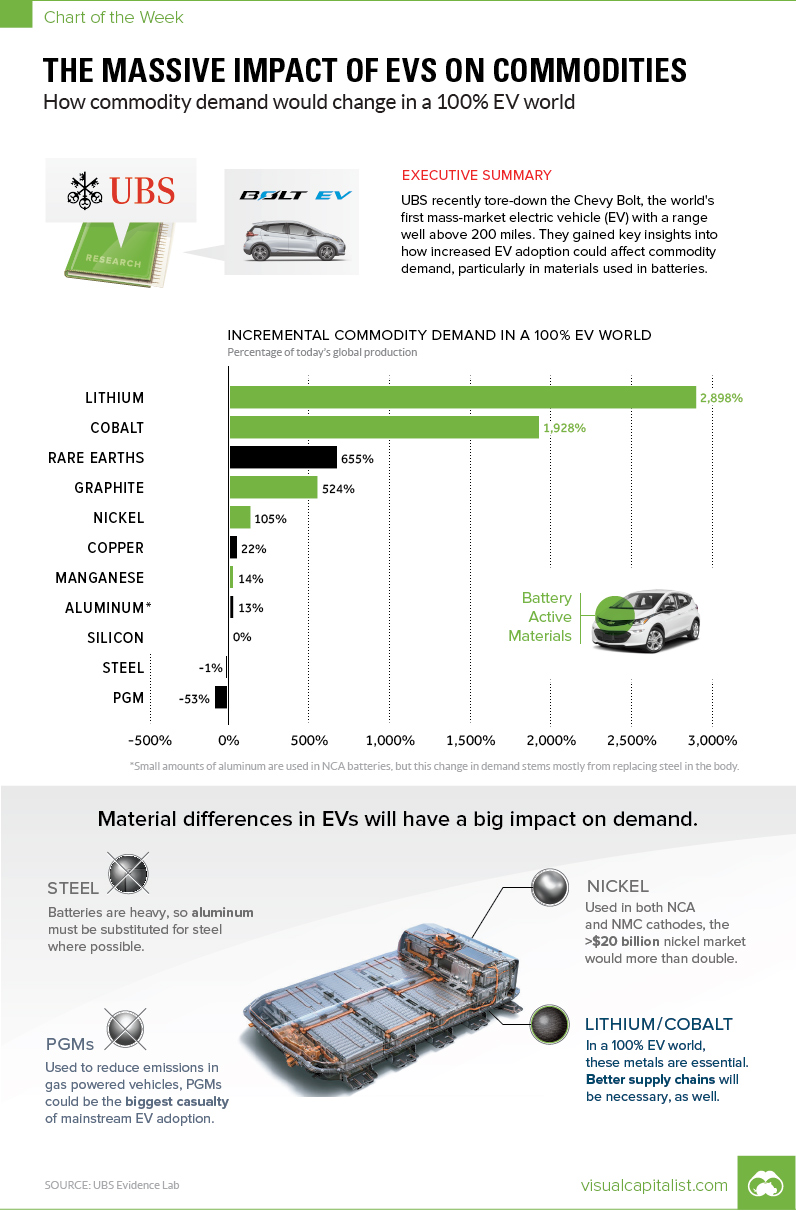
We discovered this “100% EV world” thought experiment in a UBS report that everyone should read. As a part of their UBS Evidence Lab initiative, they tore down a Chevy Bolt to see exactly what is inside, and then had 39 of the bank’s analysts weigh in on the results. After breaking down the metals and other materials used in the vehicle, they noticed a considerable amount of variance from what gets used in a standard gas-powered car. It wasn’t just the battery pack that made a difference – it was also the body and the permanent-magnet synchronous motor that had big implications. As a part of their analysis, they extrapolated the data for a potential scenario where 100% of the world’s auto demand came from Chevy Bolts, instead of the current auto mix.
The Implications
If global demand suddenly flipped in this fashion, here’s what would happen: Some caveats we think are worth noting: The Bolt is not a Tesla The Bolt uses an NMC cathode formulation (nickel, manganese, and cobalt in a 1:1:1 ratio), versus Tesla vehicles which use NCA cathodes (nickel, cobalt, and aluminum, in an estimated 16:3:1 ratio). Further, the Bolt uses an permanent-magnet synchronous motor, which is different from Tesla’s AC induction motor – the key difference there being rare earth usage. Big Markets, small markets: Lithium, cobalt, and graphite have tiny markets, and they will explode in size with any notable increase in EV demand. The nickel market, which is more than $20 billion per year, will also more than double in this scenario. It’s also worth noting that the Bolt uses low amounts of nickel in comparison to Tesla cathodes, which are 80% nickel. Meanwhile, the 100% EV scenario barely impacts the steel market, which is monstrous to begin with. The same can be said for silicon, even though the Bolt uses 6-10x more semiconductors than a regular car. The market for PGMs like platinum and palladium, however, gets decimated in this hypothetical scenario – that’s because their use as catalysts in combustion engines are a primary source of demand.
on Today’s chart measures the extent to which 41 major economies are reopening, by plotting two metrics for each country: the mobility rate and the COVID-19 recovery rate: Data for the first measure comes from Google’s COVID-19 Community Mobility Reports, which relies on aggregated, anonymous location history data from individuals. Note that China does not show up in the graphic as the government bans Google services. COVID-19 recovery rates rely on values from CoronaTracker, using aggregated information from multiple global and governmental databases such as WHO and CDC.
Reopening Economies, One Step at a Time
In general, the higher the mobility rate, the more economic activity this signifies. In most cases, mobility rate also correlates with a higher rate of recovered people in the population. Here’s how these countries fare based on the above metrics. Mobility data as of May 21, 2020 (Latest available). COVID-19 case data as of May 29, 2020. In the main scatterplot visualization, we’ve taken things a step further, assigning these countries into four distinct quadrants:
1. High Mobility, High Recovery
High recovery rates are resulting in lifted restrictions for countries in this quadrant, and people are steadily returning to work. New Zealand has earned praise for its early and effective pandemic response, allowing it to curtail the total number of cases. This has resulted in a 98% recovery rate, the highest of all countries. After almost 50 days of lockdown, the government is recommending a flexible four-day work week to boost the economy back up.
2. High Mobility, Low Recovery
Despite low COVID-19 related recoveries, mobility rates of countries in this quadrant remain higher than average. Some countries have loosened lockdown measures, while others did not have strict measures in place to begin with. Brazil is an interesting case study to consider here. After deferring lockdown decisions to state and local levels, the country is now averaging the highest number of daily cases out of any country. On May 28th, for example, the country had 24,151 new cases and 1,067 new deaths.
3. Low Mobility, High Recovery
Countries in this quadrant are playing it safe, and holding off on reopening their economies until the population has fully recovered. Italy, the once-epicenter for the crisis in Europe is understandably wary of cases rising back up to critical levels. As a result, it has opted to keep its activity to a minimum to try and boost the 65% recovery rate, even as it slowly emerges from over 10 weeks of lockdown.
4. Low Mobility, Low Recovery
Last but not least, people in these countries are cautiously remaining indoors as their governments continue to work on crisis response. With a low 0.05% recovery rate, the United Kingdom has no immediate plans to reopen. A two-week lag time in reporting discharged patients from NHS services may also be contributing to this low number. Although new cases are leveling off, the country has the highest coronavirus-caused death toll across Europe. The U.S. also sits in this quadrant with over 1.7 million cases and counting. Recently, some states have opted to ease restrictions on social and business activity, which could potentially result in case numbers climbing back up. Over in Sweden, a controversial herd immunity strategy meant that the country continued business as usual amid the rest of Europe’s heightened regulations. Sweden’s COVID-19 recovery rate sits at only 13.9%, and the country’s -93% mobility rate implies that people have been taking their own precautions.
COVID-19’s Impact on the Future
It’s important to note that a “second wave” of new cases could upend plans to reopen economies. As countries reckon with these competing risks of health and economic activity, there is no clear answer around the right path to take. COVID-19 is a catalyst for an entirely different future, but interestingly, it’s one that has been in the works for a while. —Carmen Reinhart, incoming Chief Economist for the World Bank Will there be any chance of returning to “normal” as we know it?