However, the value of each metric varies greatly depending on where you live. Today’s data visualization from Max Roser at Our World in Data summarizes five basic dimensions of development across countries—and how our average standards of living have evolved since 1800.
Health: Mortality Rates and Life Expectancy
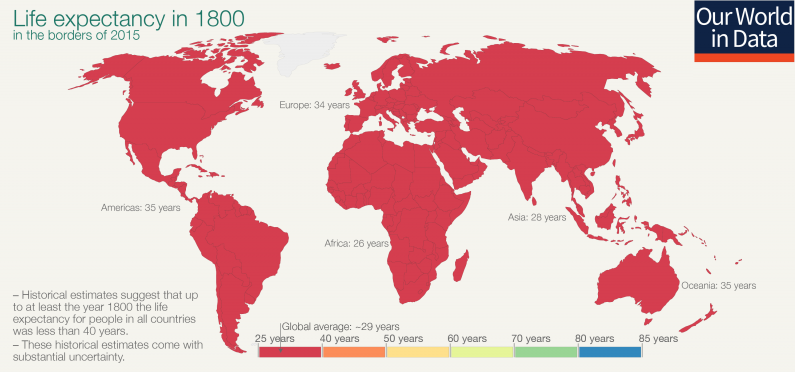
Child mortality rates and life expectancy at birth are telltale signs of a country’s overall standard of living, as they indicate a population’s ability to access healthcare services. Iceland stood at the top of these ranks in 2017, with only a 0.21% mortality rate for children under five years old. On the other end of the spectrum, Somalia had the highest child mortality rate of 12.7%—over three times the current global average. While there’s a stark contrast between the best and worst performing countries, it’s clear that even Somalia has made significant strides since 1800. At that time, the global average child mortality rate was a whopping 43%. Lower child mortality is also tied to higher life expectancy. In 1800, the average life expectancy was that of today’s millennial—only 29 years old:
Today, the global average has shot up to 72.2 years, with areas like Japan exceeding this benchmark by more than a decade.
Education: Mean and Expected Years of Schooling
Education levels are measured in two distinct ways:
Mean years: the average number of years a person aged 25+ receives in their lifetime Expected years: the total years a 2-year old child is likely to spend in school
In the 1800s, the mean and expected years of education were both less than a year—only 78 days to be precise. Low attendance rates occurred because children were expected to work during harvests, or contracted long-term illnesses that kept them at home. Since then, education levels have drastically improved:
Research shows that investing in education can greatly narrow the inequality gap. Just one additional year of school can:
Raise a person’s income by up to 10% Raise average annual GDP growth by 0.37% Reduce the probability of motherhood by 7.3% Reduce the likelihood of child marriage by >5 percentage points Source Education has a strong correlation with individual wealth, which cascades into national wealth. Not surprisingly, average income has ballooned significantly in two centuries as well. Wealth: Average GDP Per Capita Global inequality levels are the most stark when it comes to GDP per capita. While the U.S. stands at $54,225 per person in 2017, resource-rich Qatar brings in more than double this amount—an immense $116,936 per person. The global average GDP per capita is $15,469, but inequality heavily skews the bottom end of these values. In the Central African Republic, GDP per capita is only $661 today—similar to the average income two hundred years ago. A Virtuous Cycle These measures of development clearly feed into one another. Rising life expectancies are an indication of a society’s growing access to healthcare options. Compounded with more years of education, especially for women, this has had a ripple effect on declining fertility rates, contributing to higher per capita incomes. People largely agree on what goes into human well-being: life, health, sustenance, prosperity, peace, freedom, safety, knowledge, leisure, happiness… If they have improved over time, that, I submit, is progress. —Steven Pinker As technology accelerates the pace of change across these indicators, will the global inequality gap narrow more, or expand even wider?
Education has a strong correlation with individual wealth, which cascades into national wealth. Not surprisingly, average income has ballooned significantly in two centuries as well.
Wealth: Average GDP Per Capita
Global inequality levels are the most stark when it comes to GDP per capita. While the U.S. stands at $54,225 per person in 2017, resource-rich Qatar brings in more than double this amount—an immense $116,936 per person. The global average GDP per capita is $15,469, but inequality heavily skews the bottom end of these values. In the Central African Republic, GDP per capita is only $661 today—similar to the average income two hundred years ago.
A Virtuous Cycle
These measures of development clearly feed into one another. Rising life expectancies are an indication of a society’s growing access to healthcare options. Compounded with more years of education, especially for women, this has had a ripple effect on declining fertility rates, contributing to higher per capita incomes. —Steven Pinker As technology accelerates the pace of change across these indicators, will the global inequality gap narrow more, or expand even wider? on In the above infographic from NuGen Medical Devices, we explore the factors leading to the syringe shortage and take a look at the company’s innovative needle-free solution that could play an important role in closing the immunization gap.
The Immunization Gap
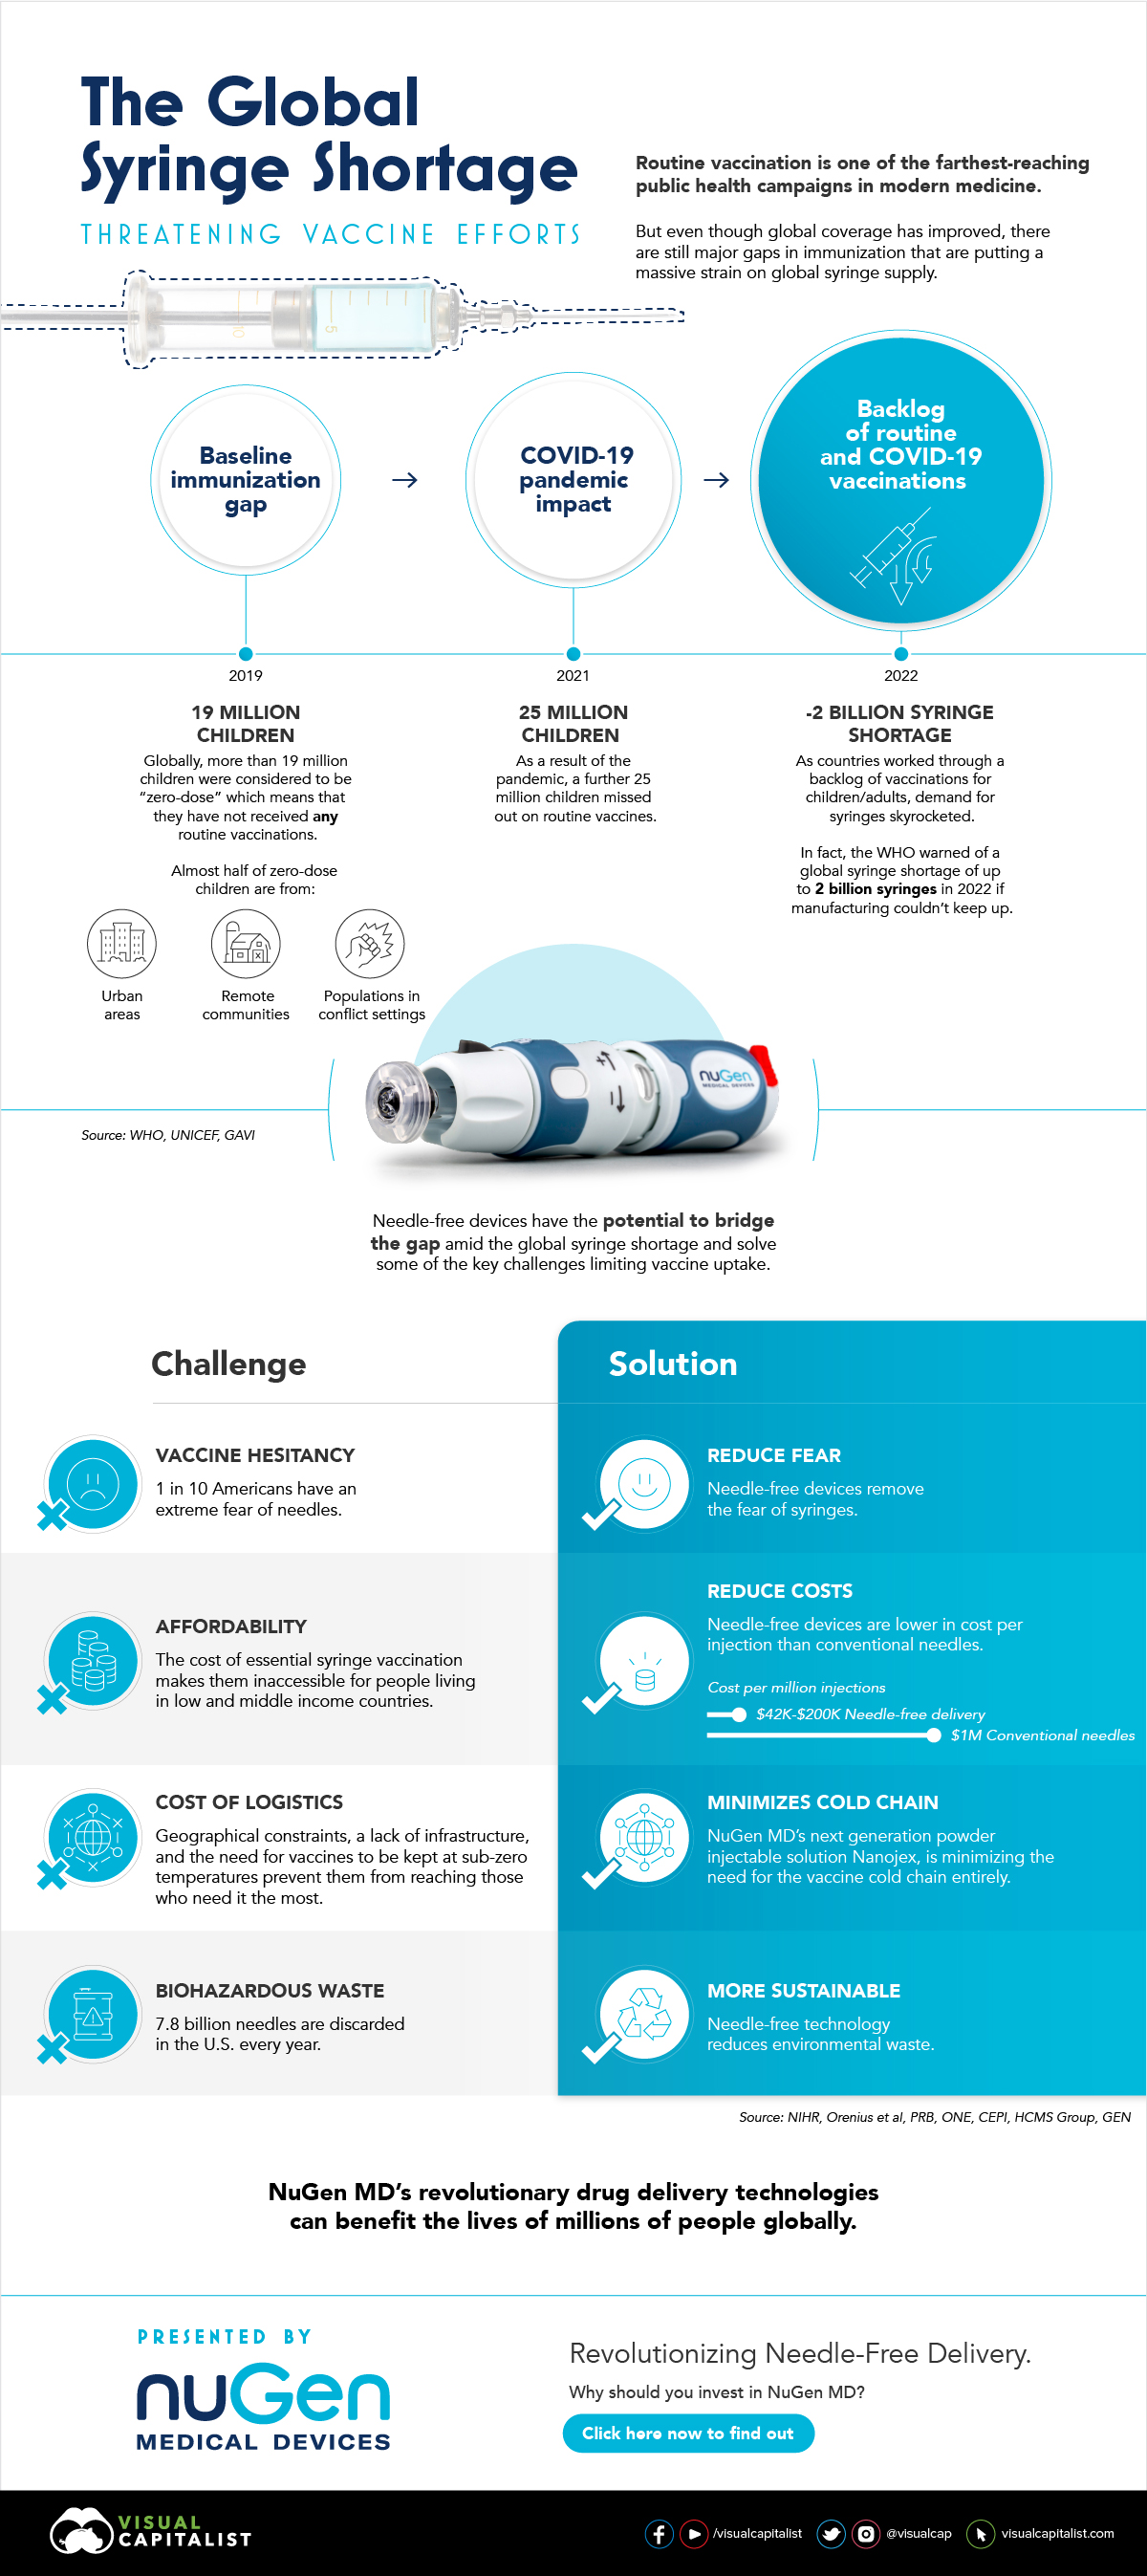
Even before the COVID-19 pandemic, millions of people around the world struggled to get access to routine vaccinations. In fact, as of 2019 more than 19 million children around the world were considered to be “zero-dose” which means that they did not receive any routine vaccinations. Moreover, when the COVID-19 pandemic hit, global immunization dropped even further with 25 million children missing out on routine vaccines in 2021 alone.
Why is Immunization So Important?
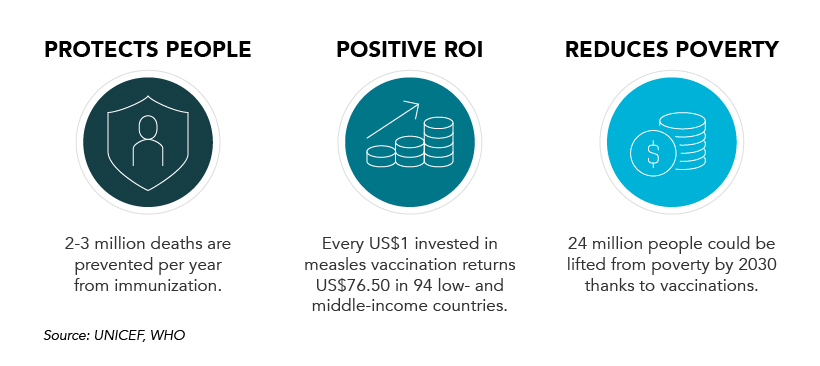
Vaccinations prevent against over 20 life-threatening diseases and save between 2-3 million deaths per year, making them—as the WHO describes—the foundation of healthcare systems and an indisputable human right. As countries work through a backlog of vaccinations to close the immunization gap that has worsened since the pandemic, demand for syringes has significantly increased.
The Result: A Global Syringe Deficit
In 2022, the WHO warned that we could see a shortage of up to 2 billion syringes if manufacturing can’t keep up. This could result in the severe disruption to routine vaccinations and promote unsafe recycling of syringes in order to administer vaccines. But the issue goes far beyond a supply shortage of syringes. COVID-19 has brought conventional syringe vaccines into sharp focus, with many criticizing the challenges associated with them. With conventional needles facing so many challenges, it’s no surprise that investors are taking interest in viable alternatives. What’s more, these alternatives don’t just apply to vaccinations, they can also work for people with diabetes, dentists, and pet care.
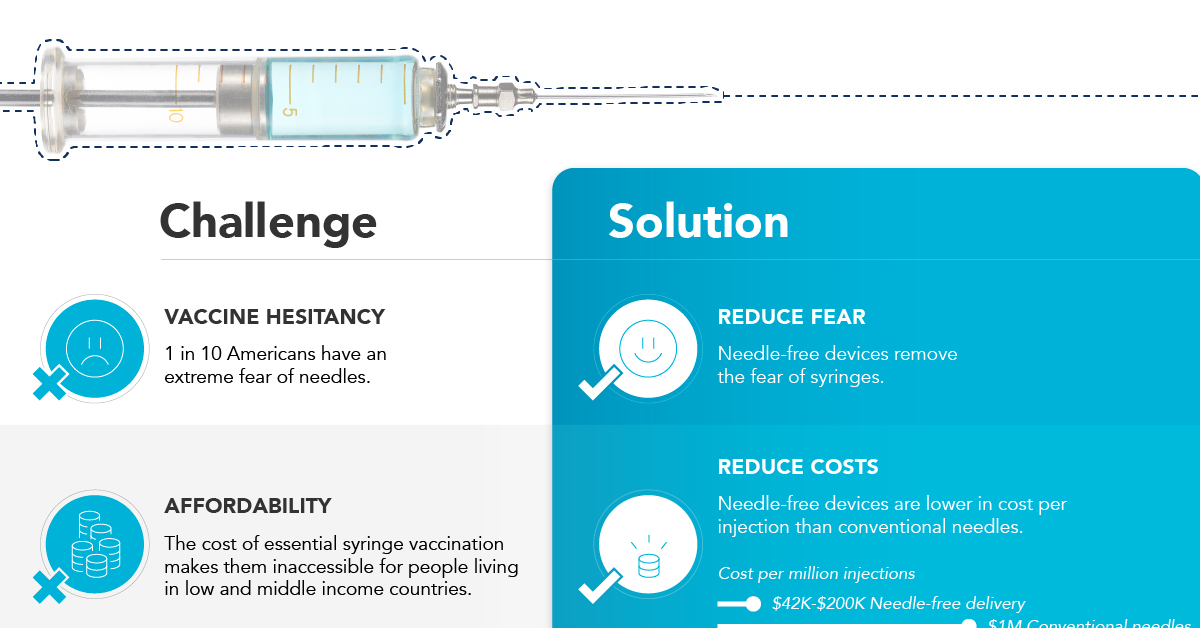
Enter Needle-free Devices from NuGen MD
Needle-free devices have the potential to bridge the gap in immunization amid the global syringe shortage, solve some of the key challenges limiting vaccine uptake, and more importantly, benefit the lives of millions of people.
How Do They Work?
NuGen’s needle-free devices use a simple spring-loaded mechanism which uses pressure to release the liquid drug and penetrate the skin. In less than one-tenth of a second, the drug is dispensed more safely and evenly compared to needle syringes. It’s also virtually painless and leaves no mark on the skin.
Interested in investing in NuGen Medical Devices? To learn more about their plans to pioneer the future of needle-free drug delivery, click this link now.