But how did this sui generis (a class by itself) political entity come into being?
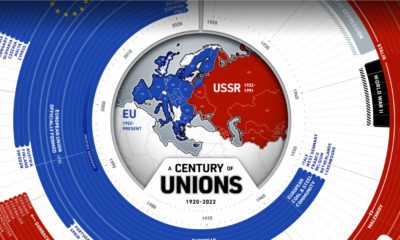
A Brief History of the EU
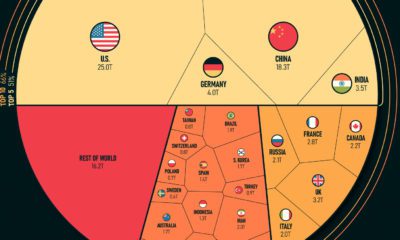
After the devastating aftermath of the World War II, Western Europe saw a concerted move towards regional peace and security by promoting democracy and protecting human rights. Crucially, the Schuman Declaration was presented in 1950. The coal and steel industries of Western Europe were integrated under common management, preventing countries from turning on each other and creating weapons of war. Six countries signed on — the eventual founders of the EU. Here’s a list of all 27 members of the EU and the year they joined. Greater economic and security cooperation followed over the next four decades, along with the addition of new members. These tighter relationships disincentivized conflict, and Western Europe—after centuries of constant war—has seen unprecedented peace for the last 80 years. The modern version of the EU can trace its origin to 1993, with the adoption of the name, ‘the European Union,’ the birth of a single market, and the promise to use a single currency—the euro. Since then the EU has become an economic and political force to reckon with. Its combined gross domestic product (GDP) stood at $16.6 trillion in 2022, after the U.S. ($26 trillion) and China ($19 trillion.)
Front Loading the EU Economy
For the impressive numbers it shows however, the European Union’s economic might is held up by three economic giants, per data from the International Monetary Fund. Put together, the GDPs of Germany ($4 trillion), France ($2.7 trillion) and Italy ($1.9 trillion) make up more than half of the EU’s entire economic output. These three countries are also the most populous in the EU, and together with Spain and Poland, account for 66% of the total population of the EU. Here’s a table of all 27 member states and the percentage they contribute to the EU’s gross domestic product. The top-heaviness continues. By adding Spain ($1.3 trillion) and the Netherlands ($990 billion), the top five make up nearly 70% of the EU’s GDP. That goes up to 85% when the top 10 countries are included. That means less than half of the 27 member states make up $14 trillion of the $16 trillion EU economy.
Older Members, Larger Share
Aside from the most populous members having bigger economies, another pattern emerges, with the time the country has spent in the EU. Five of the six founders of the EU—Germany, France, Italy, the Netherlands, Belgium—are in the top 10 biggest economies of the EU. Ireland and Denmark, the next entrants into the union (1973) are ranked 9th and 11th respectively. The bottom 10 countries all joined the EU post-2004. The UK—which joined the bloc in 1973 and formally left in 2020—would have been the second-largest economy in the region at $3.4 trillion.
Sectoral Analysis of the EU
The EU has four primary sectors of economic output: services, industry, construction, and agriculture (including fishing and forestry.) Below is an analysis of some of these sectors and the countries which contribute the most to it. All figures are from Eurostat.
Services and Tourism
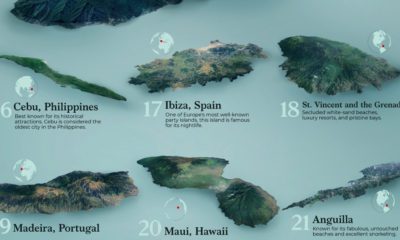
The EU economy relies heavily on the services sector, accounting for more than 70% of the value added to the economy in 2020. It also is the sector with the highest share of employment in the EU, at 73%. In Luxembourg, which has a large financial services sector, 87% of the country’s gross domestic product came from the services sector. Tourism economies like Malta and Cyprus also had an above 80% share of services in their GDP.
Industry
Meanwhile 20% of the EU’s gross domestic product came from industry, with Ireland’s economy having the most share (40%) in its GDP. Czechia, Slovenia and Poland also had a significant share of industry output. Mining coal and lignite in the EU saw a brief rebound in output in 2021, though levels continued to be subdued.
Agriculture
Less than 2% of the EU’s economy relies on agriculture, forestry and fishing. Romania, Latvia, and Greece feature as contributors to this sector, however the share in total output in each country is less than 5%. Bulgaria has the highest employment (16%) in this sector compared to other EU members.
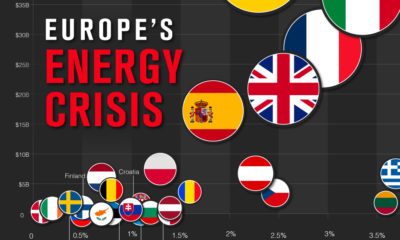
Energy
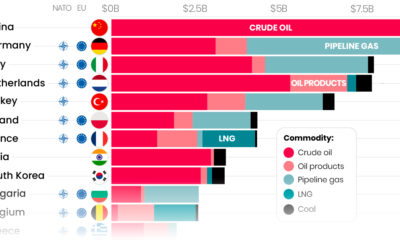
The EU imports nearly 60% of its energy requirements. Until the end of 2021, Russia was the biggest exporter of petroleum and natural gas to the region. After the war in Ukraine that share has steadily decreased from nearly 25% to 15% for petroleum liquids and from nearly 40% to 15% for natural gas, per Eurostat.
Headwinds, High Seas
The IMF has a gloomy outlook for Europe heading into 2023. War in Ukraine, spiraling energy costs, high inflation, and stagnant wage growth means that EU leaders are facing “severe trade-offs and tough policy decisions.” Reforms—to relieve supply constraints in the labor and energy markets—are key to increasing growth and relieving price pressures, according to the international body. The IMF projects that the EU will grow 0.7% in 2023. on Both figures surpassed analyst expectations by a wide margin, and in January, the unemployment rate hit a 53-year low of 3.4%. With the recent release of February’s numbers, unemployment is now reported at a slightly higher 3.6%. A low unemployment rate is a classic sign of a strong economy. However, as this visualization shows, unemployment often reaches a cyclical low point right before a recession materializes.
Reasons for the Trend
In an interview regarding the January jobs data, U.S. Treasury Secretary Janet Yellen made a bold statement: While there’s nothing wrong with this assessment, the trend we’ve highlighted suggests that Yellen may need to backtrack in the near future. So why do recessions tend to begin after unemployment bottoms out?
The Economic Cycle
The economic cycle refers to the economy’s natural tendency to fluctuate between periods of growth and recession. This can be thought of similarly to the four seasons in a year. An economy expands (spring), reaches a peak (summer), begins to contract (fall), then hits a trough (winter). With this in mind, it’s reasonable to assume that a cyclical low in the unemployment rate (peak employment) is simply a sign that the economy has reached a high point.
Monetary Policy
During periods of low unemployment, employers may have a harder time finding workers. This forces them to offer higher wages, which can contribute to inflation. For context, consider the labor shortage that emerged following the COVID-19 pandemic. We can see that U.S. wage growth (represented by a three-month moving average) has climbed substantially, and has held above 6% since March 2022. The Federal Reserve, whose mandate is to ensure price stability, will take measures to prevent inflation from climbing too far. In practice, this involves raising interest rates, which makes borrowing more expensive and dampens economic activity. Companies are less likely to expand, reducing investment and cutting jobs. Consumers, on the other hand, reduce the amount of large purchases they make. Because of these reactions, some believe that aggressive rate hikes by the Fed can either cause a recession, or make them worse. This is supported by recent research, which found that since 1950, central banks have been unable to slow inflation without a recession occurring shortly after.
Politicians Clash With Economists
The Fed has raised interest rates at an unprecedented pace since March 2022 to combat high inflation. More recently, Fed Chairman Jerome Powell warned that interest rates could be raised even higher than originally expected if inflation continues above target. Senator Elizabeth Warren expressed concern that this would cost Americans their jobs, and ultimately, cause a recession. Powell remains committed to bringing down inflation, but with the recent failures of Silicon Valley Bank and Signature Bank, some analysts believe there could be a pause coming in interest rate hikes. Editor’s note: just after publication of this article, it was confirmed that U.S. interest rates were hiked by 25 basis points (bps) by the Federal Reserve.