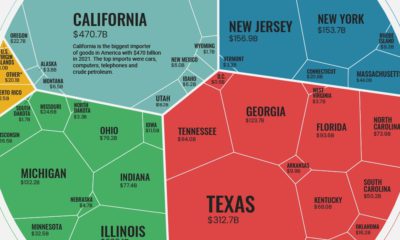
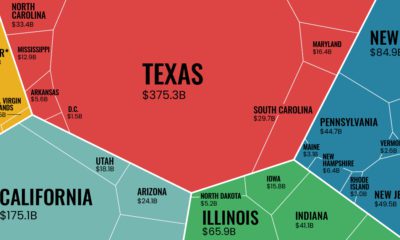
America’s trade deficit of goods shot up to a whopping record $1.1 trillion in 2021 from $922 billion in 2020, leading to its largest ever deficit. Imports dwarfed exports, reaching new highs of $2.9 trillion in 2021, while U.S. exports to other countries added up to $1.8 trillion. Using the latest data on international trade from the U.S. Census Bureau, we’ve visualized the flow of America’s annual imports and exports for selected countries. The difference between the two measures is the country’s trade deficit for goods.
Who Does the U.S. Trade Most With?
In 2021, U.S trade of goods amounted to nearly $4.6 trillion and Canada, Mexico, and China were America’s largest trading partners. Those three countries alone combined for a total trade of $1.9 trillion, equal to about 41% of all trade of goods. Let’s take a look at the 10 countries that trade the most with the United States: From a geographic perspective, the two largest trading partners are based in North America (Canada and Mexico). Meanwhile, six of the top 10 are based in Asia.
Which Countries Does the U.S. Have the Largest Trade Deficit With?
The largest trade deficit is undoubtedly with China, which accounts for more than 32% of the U.S. trade deficit in goods. The $355 billion deficit with China comes from importing $506 billion in goods such as machinery, furniture, and bedding. Interestingly, many of those imports are made by American companies who outsource their production to China. These outsourcing activities are counted as imports even though they create profit for these U.S. companies. Below we order U.S. trade partners by trade deficit of goods: The second largest U.S. trade deficit is with Mexico with $108 billion. The main imports from Mexico are cars, trucks, and auto parts. On the other side, the main exports are auto parts and petroleum products.
How Does a Trade Deficit Affect the U.S. Economy?
The U.S. has been running trade deficits since the late 1970s, so these latest numbers are a continuation of a long-term trend. Are these trade deficits a bad thing? The simple, unsatisfying answer is, it depends. When any country spends more money on imports than it makes on exports, it must somehow make up the shortfall. Typically, this means takes the form of borrowing from foreign lenders or allowing foreign investment in domestic assets. In the U.S., the trade imbalance with China is a sore point, as millions of jobs in manufacturing have been lost due to offshoring in recent decades. That said, running a trade surplus is no guarantee of strong economic performance. Germany is a prime example of a country with a massive trade surplus, but achieving only modest economic growth in recent years. on Last year, stock and bond returns tumbled after the Federal Reserve hiked interest rates at the fastest speed in 40 years. It was the first time in decades that both asset classes posted negative annual investment returns in tandem. Over four decades, this has happened 2.4% of the time across any 12-month rolling period. To look at how various stock and bond asset allocations have performed over history—and their broader correlations—the above graphic charts their best, worst, and average returns, using data from Vanguard.
How Has Asset Allocation Impacted Returns?
Based on data between 1926 and 2019, the table below looks at the spectrum of market returns of different asset allocations:
We can see that a portfolio made entirely of stocks returned 10.3% on average, the highest across all asset allocations. Of course, this came with wider return variance, hitting an annual low of -43% and a high of 54%.
A traditional 60/40 portfolio—which has lost its luster in recent years as low interest rates have led to lower bond returns—saw an average historical return of 8.8%. As interest rates have climbed in recent years, this may widen its appeal once again as bond returns may rise.
Meanwhile, a 100% bond portfolio averaged 5.3% in annual returns over the period. Bonds typically serve as a hedge against portfolio losses thanks to their typically negative historical correlation to stocks.
A Closer Look at Historical Correlations
To understand how 2022 was an outlier in terms of asset correlations we can look at the graphic below:
The last time stocks and bonds moved together in a negative direction was in 1969. At the time, inflation was accelerating and the Fed was hiking interest rates to cool rising costs. In fact, historically, when inflation surges, stocks and bonds have often moved in similar directions. Underscoring this divergence is real interest rate volatility. When real interest rates are a driving force in the market, as we have seen in the last year, it hurts both stock and bond returns. This is because higher interest rates can reduce the future cash flows of these investments. Adding another layer is the level of risk appetite among investors. When the economic outlook is uncertain and interest rate volatility is high, investors are more likely to take risk off their portfolios and demand higher returns for taking on higher risk. This can push down equity and bond prices. On the other hand, if the economic outlook is positive, investors may be willing to take on more risk, in turn potentially boosting equity prices.
Current Investment Returns in Context
Today, financial markets are seeing sharp swings as the ripple effects of higher interest rates are sinking in. For investors, historical data provides insight on long-term asset allocation trends. Over the last century, cycles of high interest rates have come and gone. Both equity and bond investment returns have been resilient for investors who stay the course.