This year has been shaped by uncomfortable macroeconomic headwinds. Trillions of dollars were erased in public company market capitalizations, investor confidence waned, and cost pressures squeezed consumer pocketbooks. Taken together, many of the world’s largest companies experienced sharp declines in market share. Still, a few companies in key sectors had positive growth over the year. As 2022 comes to a close, the above infographic shows the biggest companies in the world, using data from Companiesmarketcap.com.
The World’s Largest Public Companies in 2022
Today, Apple stands as the world’s most valuable company, towering at a $2.3 trillion valuation. Despite the tech downturn of 2022—driven by rising interest rates and slower sales—Apple maintained its top spot. This was largely thanks to record revenues and healthy consumer demand for iPhones, which drive about half of its total revenue. Following Apple is Microsoft. Unlike Apple, Microsoft has faced slower earnings over the year due to lower demand for personal computers and the weighing impact of a strong U.S. dollar. Overall, about 50% of the company’s sales take place overseas. As we show below, there are now only four companies left in the trillion dollar market cap club. *As of Dec 12, 2022. Oil giant Saudi Aramco is the third largest publicly-traded company globally, at $1.8 trillion. It’s also the only non-U.S. company in the top 10. In May, the state-run company briefly became the most valuable company on the planet as soaring energy prices boosted earnings. Saudia Arabia is the largest exporter of oil in the world, and the country’s economy is forecast to grow 7.6% in 2022—one of the fastest globally. Overall, 62 companies of the 100 largest are headquartered in the U.S., 11 are based in China, and five are located in France.
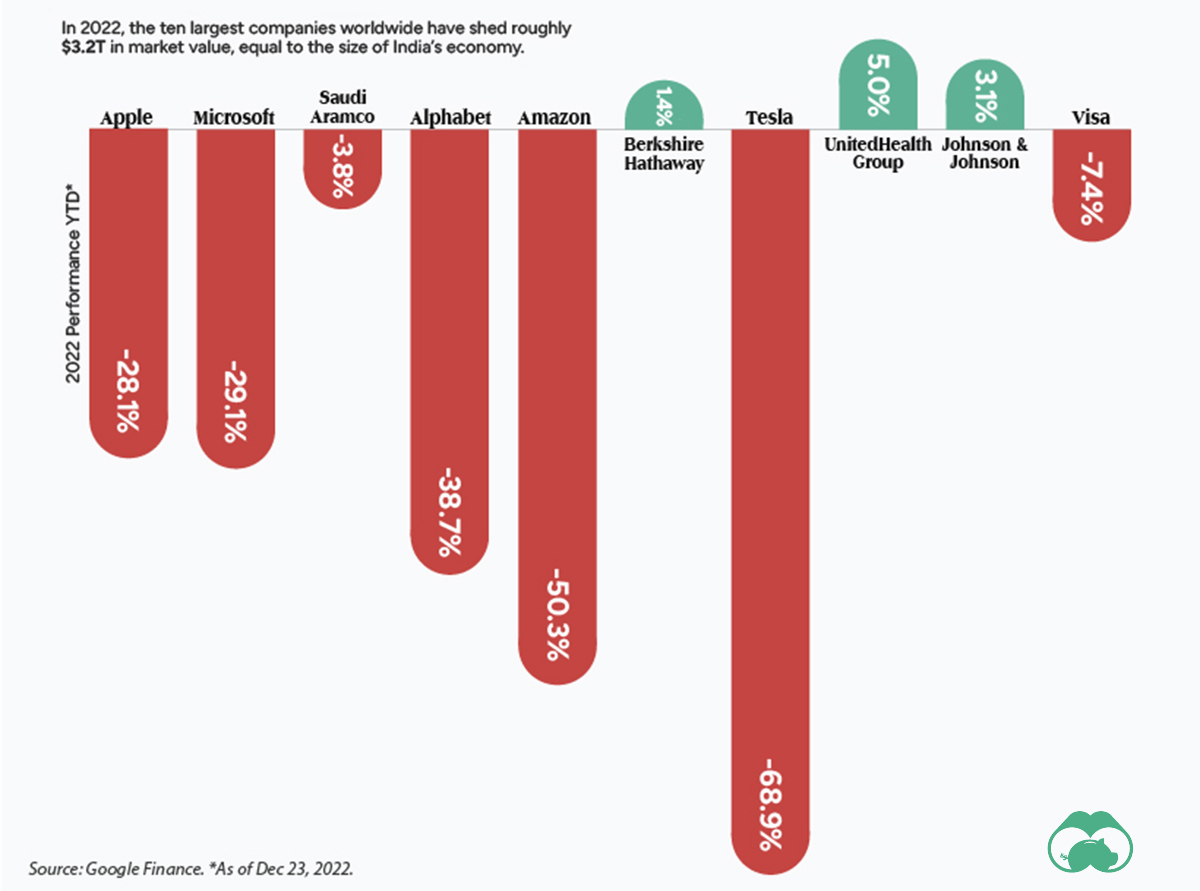
Top 10 Performance in 2022
For many of the world’s largest companies, 2022 was a brutal year for performance.
As the above graphic shows, the vast majority of the world’s titans saw their market values decline. Half of these companies saw double-digit drops. Tesla has witnessed nearly 70% of its market cap being erased this year. Two main factors are behind this drop: falling demand, especially in China, and CEO Elon Musk’s volatile and risky acquisition of Twitter. On the other hand, UnitedHealth Group has seen the strongest performance among the top 10. The company, which rakes in a large share of its earnings from employer-backed insurance plans, said that recessionary impacts had not yet begun materializing in 2022.
Biggest Companies in the World, by Sector
Even with sinking market values across the sector in 2022, tech remains dominant. Among the world’s biggest companies, 20 are in tech, spanning a combined market value of $9.2 trillion. For perspective, that’s about 31% of the market value of the 100 largest companies. Companies are classified according to the FTSE Russell Industry Classification Benchmark. *As of Dec 12, 2022. At the other end of the spectrum is utilities, the smallest sector overall at least pertaining to the largest companies list. NextEra Energy, the sole utilities company among the rankings is one of the world’s largest developers of wind and solar energy. Over the next three years, it plans to invest up to $95 billion in greening its power operations.
Change of Fortune
It comes as no surprise that many of the biggest companies in the world are long-established players in global markets. Yet within the rankings, some of the notable risers compared to 2021 are UnitedHealth Group, which launched from #19 in 2021 to #8 this year and NVIDIA which has climbed to become the 11th largest company globally, up from #24 last year. By contrast, some of the biggest losers are Meta (Facebook’s parent company) and Alibaba. Meta has fallen across the rankings to #26 in 2022 from #6 in 2021. Meanwhile, Alibaba was once the ninth largest globally but has tumbled to #36. Both companies have seen considerable value wiped from their market caps—roughly 66% and 28%, respectively—amid lagging earnings. With the year coming to a close, it remains to be seen whether the world’s biggest companies stage a comeback in 2023, or face more challenging conditions ahead. on Last year, stock and bond returns tumbled after the Federal Reserve hiked interest rates at the fastest speed in 40 years. It was the first time in decades that both asset classes posted negative annual investment returns in tandem. Over four decades, this has happened 2.4% of the time across any 12-month rolling period. To look at how various stock and bond asset allocations have performed over history—and their broader correlations—the above graphic charts their best, worst, and average returns, using data from Vanguard.
How Has Asset Allocation Impacted Returns?
Based on data between 1926 and 2019, the table below looks at the spectrum of market returns of different asset allocations:
We can see that a portfolio made entirely of stocks returned 10.3% on average, the highest across all asset allocations. Of course, this came with wider return variance, hitting an annual low of -43% and a high of 54%.
A traditional 60/40 portfolio—which has lost its luster in recent years as low interest rates have led to lower bond returns—saw an average historical return of 8.8%. As interest rates have climbed in recent years, this may widen its appeal once again as bond returns may rise.
Meanwhile, a 100% bond portfolio averaged 5.3% in annual returns over the period. Bonds typically serve as a hedge against portfolio losses thanks to their typically negative historical correlation to stocks.
A Closer Look at Historical Correlations
To understand how 2022 was an outlier in terms of asset correlations we can look at the graphic below:
The last time stocks and bonds moved together in a negative direction was in 1969. At the time, inflation was accelerating and the Fed was hiking interest rates to cool rising costs. In fact, historically, when inflation surges, stocks and bonds have often moved in similar directions. Underscoring this divergence is real interest rate volatility. When real interest rates are a driving force in the market, as we have seen in the last year, it hurts both stock and bond returns. This is because higher interest rates can reduce the future cash flows of these investments. Adding another layer is the level of risk appetite among investors. When the economic outlook is uncertain and interest rate volatility is high, investors are more likely to take risk off their portfolios and demand higher returns for taking on higher risk. This can push down equity and bond prices. On the other hand, if the economic outlook is positive, investors may be willing to take on more risk, in turn potentially boosting equity prices.
Current Investment Returns in Context
Today, financial markets are seeing sharp swings as the ripple effects of higher interest rates are sinking in. For investors, historical data provides insight on long-term asset allocation trends. Over the last century, cycles of high interest rates have come and gone. Both equity and bond investment returns have been resilient for investors who stay the course.