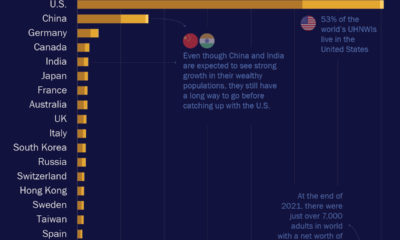
High net worth individuals (HNWIs) – persons with wealth over US$1 million – may decide to pick up and move for a number of reasons. In some cases they are attracted by jurisdictions with more favorable tax laws, or less pollution and crime. Sometimes, they’re simply looking for a change of scenery. Today’s graphic, using data from the annual Global Wealth Migration Review, maps the migration of the world’s millionaires, and clearly shows which countries are magnets for the world’s rich, and which countries are seeing a wealth exodus.
The Flight of the Millionaires
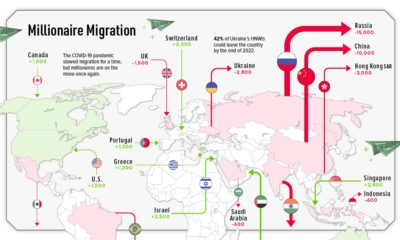
It’s no secret that China has been a wealth creation machine over the past two decades. Although the country is still making a number of its citizens very wealthy, over 15,000 Chinese HNWIs still chose to migrate to other countries in 2018 – the most significant migration of any country. Here’s a look at the top countries by HNWI outflows: Figures rounded to nearest 1000. Unlike the middle class, wealthy citizens have the means to pick up and leave when things start to sideways in their home country. An uptick in HNWI migration from a country can often be a signal of negative economic or societal factors influencing a country. This is the case in Turkey, which has been rocked by instability, mass protests, and an inflation rate estimated to be in the triple-digits by some sources. For the third straight year, Turkey lost more than 4,000 millionaires. An estimated 10% of Turkey’s HNWIs fled in 2018, which is concerning because unlike China and India, the country is not producing new millionaires in any significant number.
Millionaire Magnets
Time-honored locations – such as Switzerland and the Cayman Islands – continue to attract the world’s wealthy, but no country is experiencing HNWI inflows quite like Australia. The Land Down Under has a number of attributes that make it an attractive destination for migrating millionaires. The country has a robust economy, and is perceived as being a safe place to raise a family. Even better, Australia has no inheritance tax and a lower cost of health care, which can make it an attractive alternative to the U.S. In 2018, Australia jumped ahead of both Canada and France to become the seventh largest wealth market in the world. Here’s a look at HNWI inflows around the world: Figures rounded to nearest 1000. *Bermuda, Cayman Islands, Virgin Islands, St Barts, Antigua, St Kitts & Nevis, etc Greece, which was one of the worst performing wealth markets of the last decade, is finally seeing a modest inflow of millionaires again. on To see how the minimum wage differs around the world, we’ve visualized data from Picodi, which includes values for 67 countries as of January 2023.
Monthly Minimum Wage, by Country
The following table includes all of the data used in this infographic. Each value represents the monthly minimum wage a full-time worker would receive in each country. Picodi states that these figures are net of taxes and have been converted to USD. Generally speaking, developed countries have a higher cost of living, and thus require a higher minimum wage. Two outliers in this dataset are Argentina and Turkey, which have increased their minimum wages by 100% or more from January 2022 levels. Turkey is suffering from an ongoing currency crisis, with the lira losing over 40% of its value in 2021. Prices of basic goods have increased considerably as the Turkish lira continues to plummet. In fact, a 2022 survey found that 70% of people in Turkey were struggling to pay for food. Argentina, South America’s second-biggest economy, is also suffering from very high inflation. In response, the country announced three minimum wage increases throughout 2022.
Minimum Wage in the U.S.
Within the U.S., minimum wage varies significantly by state. We’ve visualized each state’s basic minimum rate (hourly) using January 2023 data from the U.S. Department of Labor.
2023-03-17 Update: This map was updated to fix several incorrect values. We apologize for any confusion this may have caused. America’s federal minimum wage has remained unchanged since 2009 at $7.25 per hour. Each state is allowed to set their own minimum wage, as long as it’s higher than the federal minimum. In states that do not set their own minimum, the federal minimum applies. If we assume someone works 40 hours a week, the federal minimum wage of $7.25 translates to an annual figure of just $15,080 before taxes. California’s minimum wage of $15.50 translates to $32,240 before taxes. For further perspective, check out our 2022 infographic on the salary needed to buy a home across 50 U.S. cities.