For fast-moving companies like Airbnb, Stripe, Uber, Facebook, or Slack, the piping – such as the internet and smartphones – is already well-established, allowing these startups to scale at unprecedented speeds. For 3D printing and other such “hard” technologies? Things end up being a lot more complicated.
A Long Time Coming
The rise of 3D printing reached peak hype years ago – and as far back as 2014, we were illustrating how 3D printing could ultimately shape the future of business. However, since those days, the technology has arguably fallen into the dreaded “trough of disillusionment” category on the famous Gartner Hype Cycle. The harsh reality is that it’s just really hard to move things like 3D printing forward at the same type of speed as software. For the technology to scale at a commercial level, products would need to be flawless and intuitive from the get-go (they weren’t), and all engineering, technological, and design problems would need to be solved at lightning-quick speeds. Instead, it takes huge amounts of research, investment, patience, and iterations to get to the next level. Today’s infographic comes to us from Raconteur, and it highlights a most recent snapshot of the 3D printing industry. Importantly, it shows that the technology is still chugging along in a way that is changing how things are made – just at a less hype-worthy pace.
Building From Ground Up
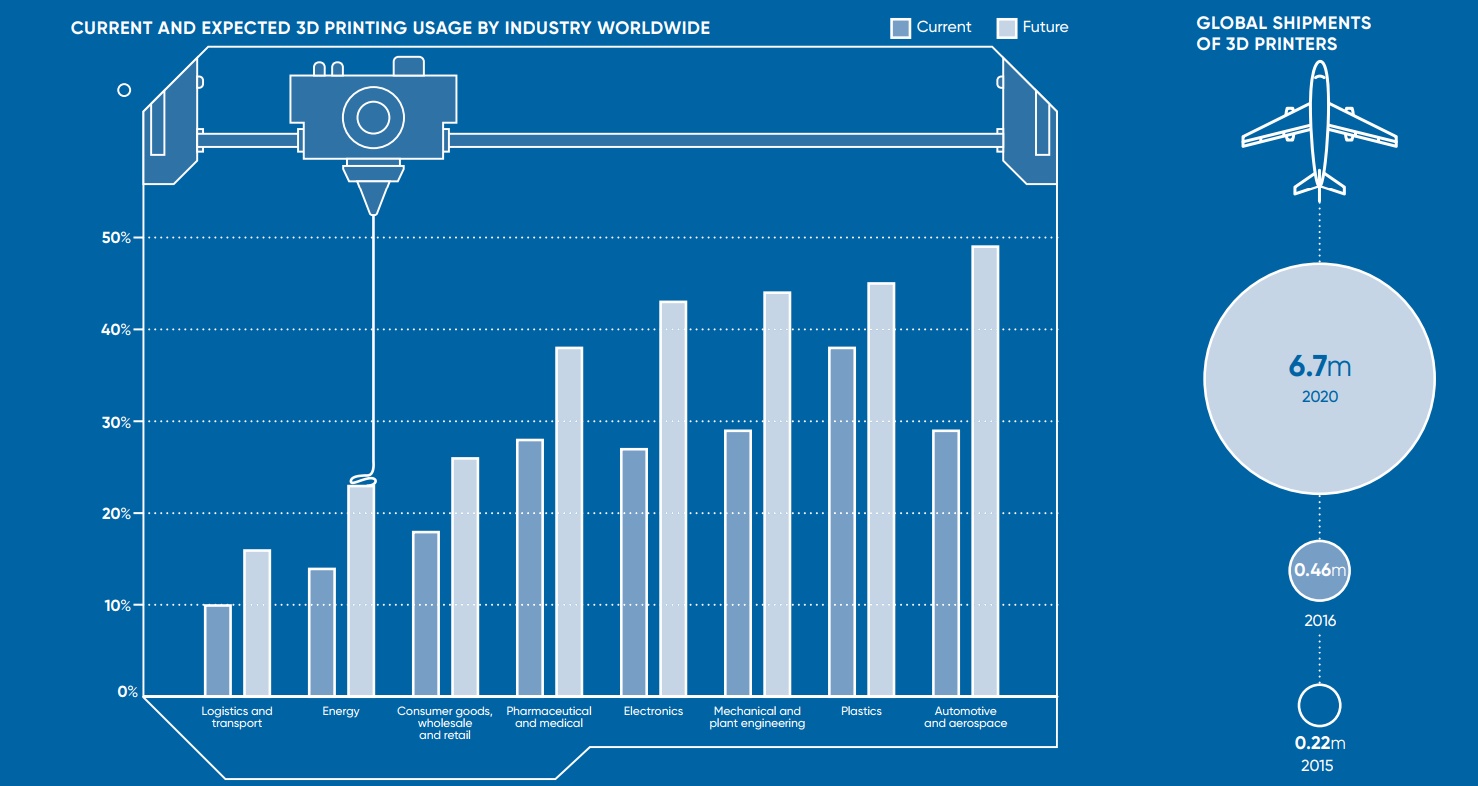
3D printing has now permeated practically every industry in at least some capacity, being used in a wide range of sectors from consumer goods to pharmaceuticals. According to a report by EY, the potential for additive manufacturing is highest in the automotive and aerospace industries. For example, it’s expected that about half (49%) of automotive companies will use 3D printing to directly manufacture car parts in order to achieve operational efficiencies. These companies believe that 3D printing will help them address challenges such as demand for increased customization, continued improvement, and lightweight components. As a result of increased demand and more familiarity with the technology, Gartner said shipments of 3D printers increased 108% between 2015 and 2016, resulting in 456,000 units shipped globally. More importantly, by 2020 this number will be at 6.7 million units, which would represent phenomenal growth for the technology. As of today, most companies are still using 3D printers for accelerating product development, such as prototyping (34% of applications) and for proof of concept (23%). However, as 3D printing gets more use in additional areas – such as mass customization and collaboration on products – it’s possible the ship will really begin to sail, even if it was slightly delayed in getting out of the gate. on These are in the form of Treasury securities, some of the most liquid assets worldwide. Central banks use them for foreign exchange reserves and private investors flock to them during flights to safety thanks to their perceived low default risk. Beyond these reasons, foreign investors may buy Treasuries as a store of value. They are often used as collateral during certain international trade transactions, or countries can use them to help manage exchange rate policy. For example, countries may buy Treasuries to protect their currency’s exchange rate from speculation. In the above graphic, we show the foreign holders of the U.S. national debt using data from the U.S. Department of the Treasury.
Top Foreign Holders of U.S. Debt
With $1.1 trillion in Treasury holdings, Japan is the largest foreign holder of U.S. debt. Japan surpassed China as the top holder in 2019 as China shed over $250 billion, or 30% of its holdings in four years. This bond offloading by China is the one way the country can manage the yuan’s exchange rate. This is because if it sells dollars, it can buy the yuan when the currency falls. At the same time, China doesn’t solely use the dollar to manage its currency—it now uses a basket of currencies. Here are the countries that hold the most U.S. debt: As the above table shows, the United Kingdom is the third highest holder, at over $655 billion in Treasuries. Across Europe, 13 countries are notable holders of these securities, the highest in any region, followed by Asia-Pacific at 11 different holders. A handful of small nations own a surprising amount of U.S. debt. With a population of 70,000, the Cayman Islands own a towering amount of Treasury bonds to the tune of $284 billion. There are more hedge funds domiciled in the Cayman Islands per capita than any other nation worldwide. In fact, the four smallest nations in the visualization above—Cayman Islands, Bermuda, Bahamas, and Luxembourg—have a combined population of just 1.2 million people, but own a staggering $741 billion in Treasuries.
Interest Rates and Treasury Market Dynamics
Over 2022, foreign demand for Treasuries sank 6% as higher interest rates and a strong U.S. dollar made owning these bonds less profitable. This is because rising interest rates on U.S. debt makes the present value of their future income payments lower. Meanwhile, their prices also fall. As the chart below shows, this drop in demand is a sharp reversal from 2018-2020, when demand jumped as interest rates hovered at historic lows. A similar trend took place in the decade after the 2008-09 financial crisis when U.S. debt holdings effectively tripled from $2 to $6 trillion.
Driving this trend was China’s rapid purchase of Treasuries, which ballooned from $100 billion in 2002 to a peak of $1.3 trillion in 2013. As the country’s exports and output expanded, it sold yuan and bought dollars to help alleviate exchange rate pressure on its currency. Fast-forward to today, and global interest-rate uncertainty—which in turn can impact national currency valuations and therefore demand for Treasuries—continues to be a factor impacting the future direction of foreign U.S. debt holdings.