Chart: The Profile of a House With Negative Wealth
14% of all U.S. Households Have More Debts Than Assets
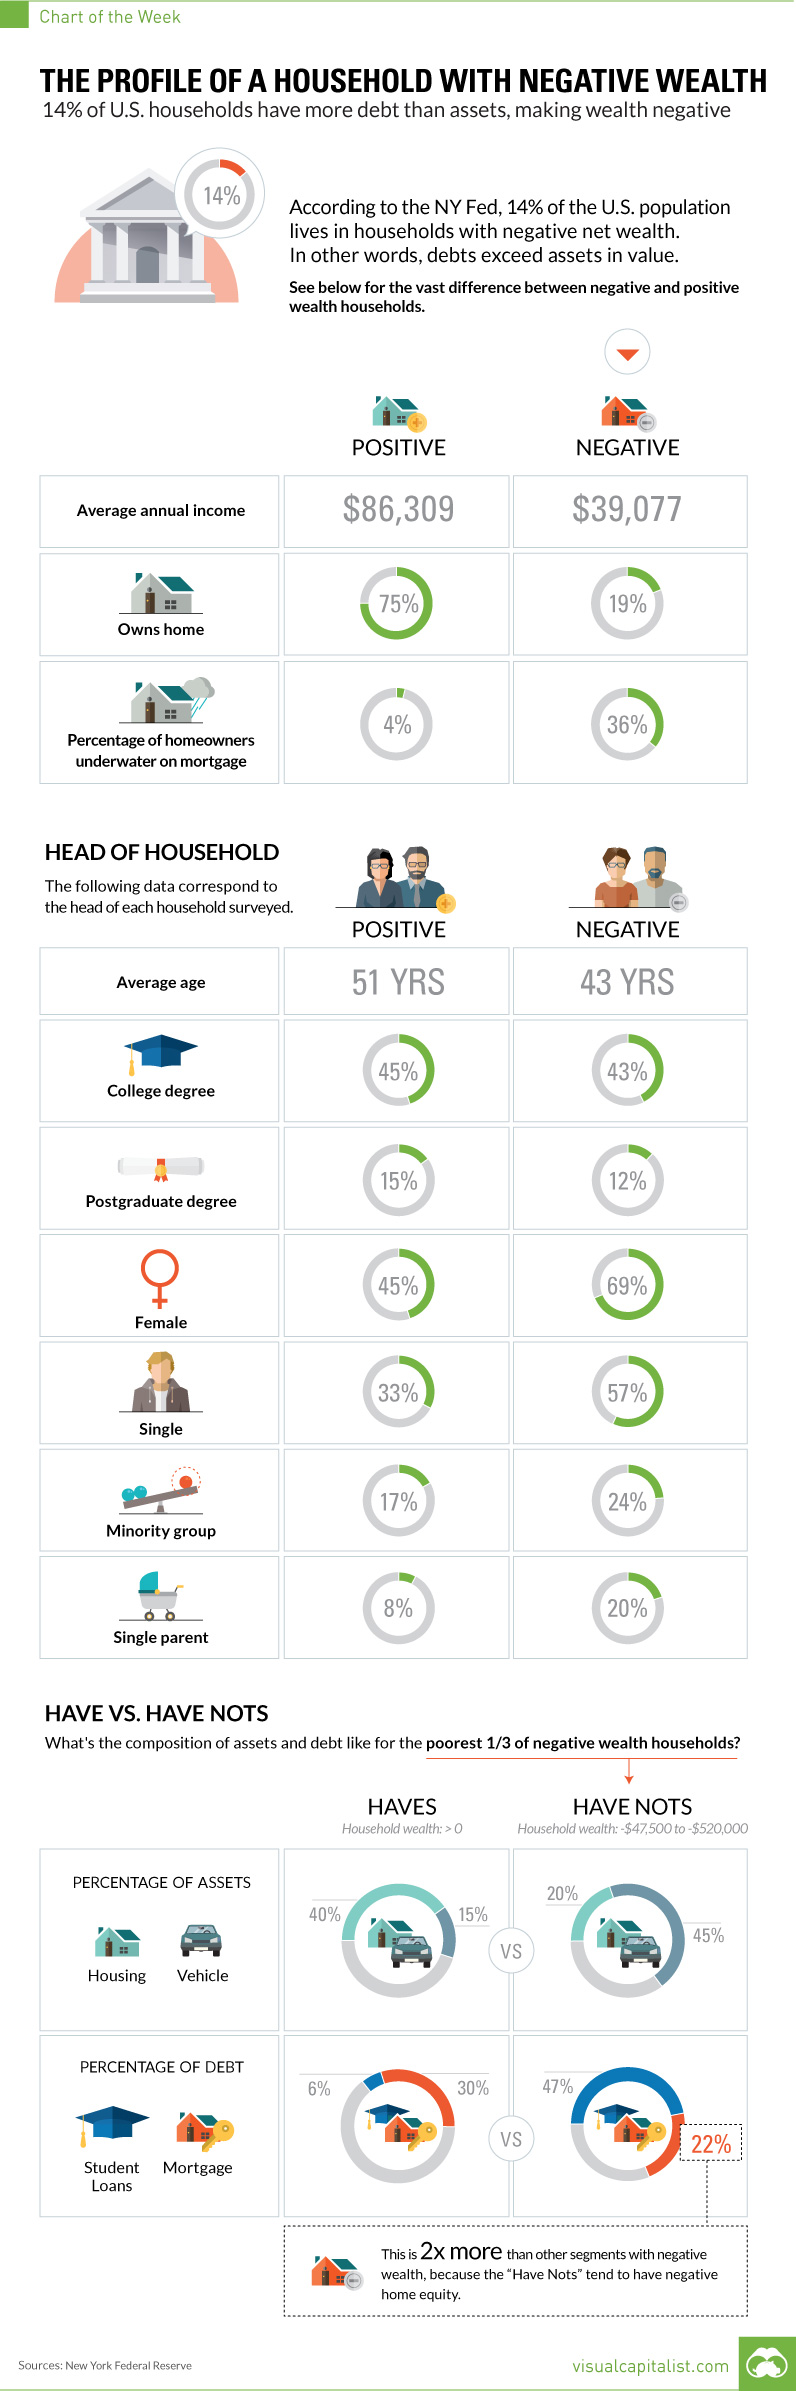
The Chart of the Week is a weekly Visual Capitalist feature on Fridays. According to the New York Federal Reserve, 14% of the U.S. population lives in households that have “negative” wealth. In other words, these are households that have more debts piled up than assets, which puts their net worth in minus territory. But what does a negative wealth household look like? In today’s chart, we compare the data on negative wealth households with the data on their positive counterparts. There are some obvious and stark contrasts.
Positive vs. Negative Households
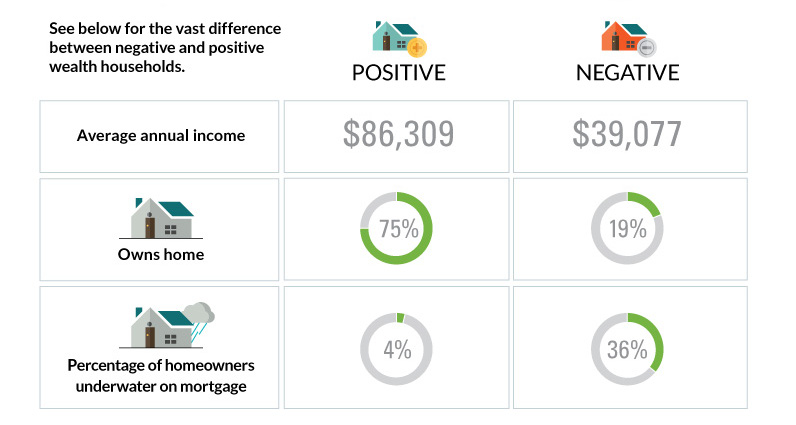
At the household level, the differences are probably what you would expect. Negative wealth households bring in $39,077 in annual income, and only 19% of these families own their home. More than one-third (36%) of these mortgages are underwater. Meanwhile, positive wealth households bring in $86,309 in annual income, and 75% of the families own their home. Only 4% of the mortgages are underwater.
The Head of the Household
For each of these households, we have data on the person that is the head of the household, or the breadwinner for each family. In terms of education, there isn’t a big difference between the heads of negative and positive wealth households. Both seem to be similarly accomplished in terms of achieving college degrees (43% vs. 45%) and postgraduate degrees (12% vs. 15%). However, there are greater differences when it comes to demographic profiles. Negative wealth households have heads that are younger (43 vs. 51 years old), female (69% vs. 45%), and single (57% vs. 33%). There is also a higher proportion of minorities (24% vs. 17%) and single parents (20% vs. 7%) living in negative wealth households.
The Have and Have Nots
We also wanted to see the difference in composition of both assets and debts. In this case, we are comparing the poorest third of those with negative wealth (-$47,500 to -$520,000) to those with positive wealth. Households that are deep in the red have the majority of their wealth in the family car – automobiles make up 45% of the value of their total assets. Housing makes up 20% of their assets by value. For positive wealth households, it is the reverse: 40% of wealth is in the home, and 15% in vehicles. The composition of debt is also very telling. Negative wealth households have a whopping 47% of debt in student loans, while positive houses have just 6%. on To see how the minimum wage differs around the world, we’ve visualized data from Picodi, which includes values for 67 countries as of January 2023.
Monthly Minimum Wage, by Country
The following table includes all of the data used in this infographic. Each value represents the monthly minimum wage a full-time worker would receive in each country. Picodi states that these figures are net of taxes and have been converted to USD. Generally speaking, developed countries have a higher cost of living, and thus require a higher minimum wage. Two outliers in this dataset are Argentina and Turkey, which have increased their minimum wages by 100% or more from January 2022 levels. Turkey is suffering from an ongoing currency crisis, with the lira losing over 40% of its value in 2021. Prices of basic goods have increased considerably as the Turkish lira continues to plummet. In fact, a 2022 survey found that 70% of people in Turkey were struggling to pay for food. Argentina, South America’s second-biggest economy, is also suffering from very high inflation. In response, the country announced three minimum wage increases throughout 2022.
Minimum Wage in the U.S.
Within the U.S., minimum wage varies significantly by state. We’ve visualized each state’s basic minimum rate (hourly) using January 2023 data from the U.S. Department of Labor.
2023-03-17 Update: This map was updated to fix several incorrect values. We apologize for any confusion this may have caused. America’s federal minimum wage has remained unchanged since 2009 at $7.25 per hour. Each state is allowed to set their own minimum wage, as long as it’s higher than the federal minimum. In states that do not set their own minimum, the federal minimum applies. If we assume someone works 40 hours a week, the federal minimum wage of $7.25 translates to an annual figure of just $15,080 before taxes. California’s minimum wage of $15.50 translates to $32,240 before taxes. For further perspective, check out our 2022 infographic on the salary needed to buy a home across 50 U.S. cities.