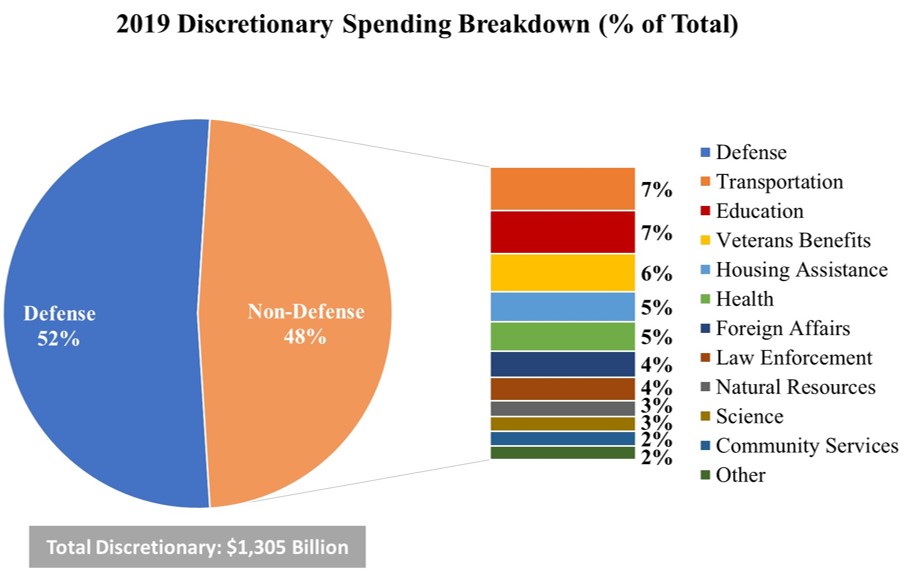
While the largest categories of spending, such as entitlement programs or debt interest, do not offer lawmakers a lot of flexibility, the government does get to decide how discretionary spending – about $1.3 trillion in FY2019 – gets put to use.
Discretionary Spending Over Time
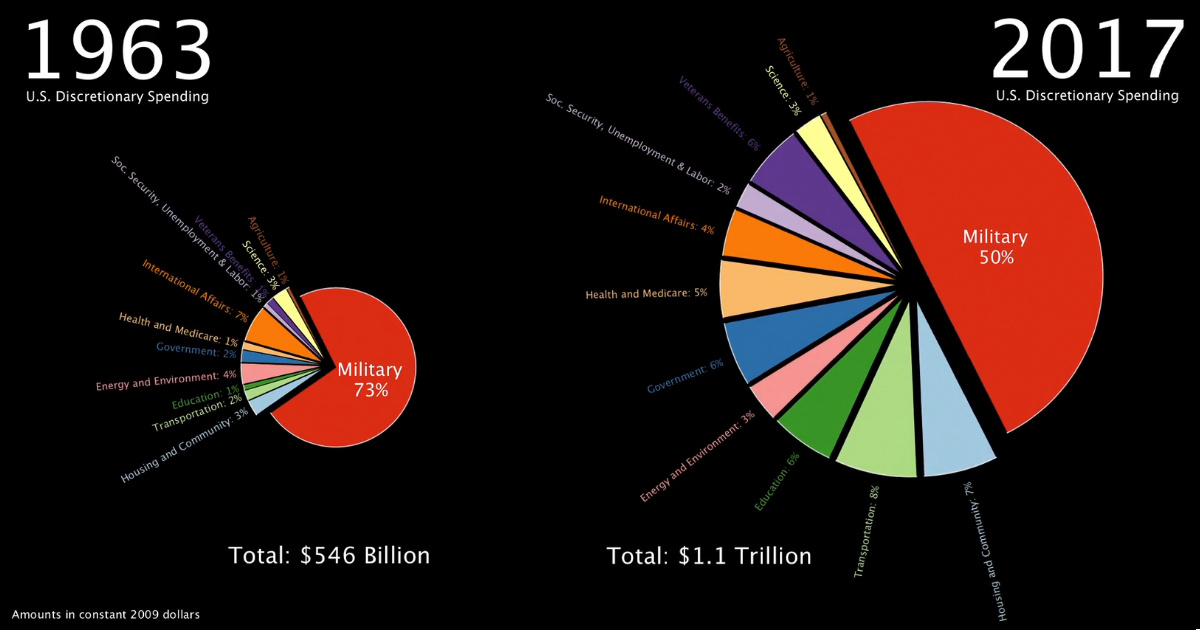
Today’s animation from data scientist Will Geary shows the evolution of U.S. discretionary spending from 1963 until today:
The U.S. budget is generally divided into three main categories: Discretionary Spending: This category, depicted in the animation, is the optional part of the budgetary equation – it’s the aspect that most people talk about, as the allocation of funding towards different things like defense, education, and transportation can be changed by lawmakers. Mandatory Spending: Also known as entitlement spending, this category includes funding for programs such as Social Security, Medicare, and Medicaid. It’s called mandatory spending because the government legally is committed to fulfilling these obligations, and it exists outside of the normal budget appropriations process. Net Interest: This category is for payments on the national debt, also something that is necessary unless the country is willing to default on these obligations.
Discretionary Spending Today
As the animation shows, after adjusting for inflation (using 2009 dollars), discretionary spending has doubled since 1963. In 1963, which was essentially the height of the Cold War, the U.S. was spending 73% on the military to make up the vast majority of the $547 billion (2009 dollars) in discretionary spending. Meanwhile, in Fiscal Year 2019, the government has allocated $1.3 trillion (today’s dollars) to the budget:
Things haven’t changed much since 1963 in that defense still comprises the majority of spending – in fact, the only recent time periods where U.S. defense spending fell below 50% were roughly between 1977-1981 and 1999-2004. American spending on defense dwarfs all other countries, but there are other categories that make up decent chunks of the discretionary budget as well. While they seem small on the above chart, transportation (7%), education (7%), and veteran benefits (6%) are all actually categories that receive over $70 billion of annual funding – still a significant piece of change.
on Both figures surpassed analyst expectations by a wide margin, and in January, the unemployment rate hit a 53-year low of 3.4%. With the recent release of February’s numbers, unemployment is now reported at a slightly higher 3.6%. A low unemployment rate is a classic sign of a strong economy. However, as this visualization shows, unemployment often reaches a cyclical low point right before a recession materializes.
Reasons for the Trend
In an interview regarding the January jobs data, U.S. Treasury Secretary Janet Yellen made a bold statement: While there’s nothing wrong with this assessment, the trend we’ve highlighted suggests that Yellen may need to backtrack in the near future. So why do recessions tend to begin after unemployment bottoms out?
The Economic Cycle
The economic cycle refers to the economy’s natural tendency to fluctuate between periods of growth and recession. This can be thought of similarly to the four seasons in a year. An economy expands (spring), reaches a peak (summer), begins to contract (fall), then hits a trough (winter). With this in mind, it’s reasonable to assume that a cyclical low in the unemployment rate (peak employment) is simply a sign that the economy has reached a high point.
Monetary Policy
During periods of low unemployment, employers may have a harder time finding workers. This forces them to offer higher wages, which can contribute to inflation. For context, consider the labor shortage that emerged following the COVID-19 pandemic. We can see that U.S. wage growth (represented by a three-month moving average) has climbed substantially, and has held above 6% since March 2022. The Federal Reserve, whose mandate is to ensure price stability, will take measures to prevent inflation from climbing too far. In practice, this involves raising interest rates, which makes borrowing more expensive and dampens economic activity. Companies are less likely to expand, reducing investment and cutting jobs. Consumers, on the other hand, reduce the amount of large purchases they make. Because of these reactions, some believe that aggressive rate hikes by the Fed can either cause a recession, or make them worse. This is supported by recent research, which found that since 1950, central banks have been unable to slow inflation without a recession occurring shortly after.
Politicians Clash With Economists
The Fed has raised interest rates at an unprecedented pace since March 2022 to combat high inflation. More recently, Fed Chairman Jerome Powell warned that interest rates could be raised even higher than originally expected if inflation continues above target. Senator Elizabeth Warren expressed concern that this would cost Americans their jobs, and ultimately, cause a recession. Powell remains committed to bringing down inflation, but with the recent failures of Silicon Valley Bank and Signature Bank, some analysts believe there could be a pause coming in interest rate hikes. Editor’s note: just after publication of this article, it was confirmed that U.S. interest rates were hiked by 25 basis points (bps) by the Federal Reserve.