Mapping Affordability in the Epicenter of Canada’s Housing Bubble
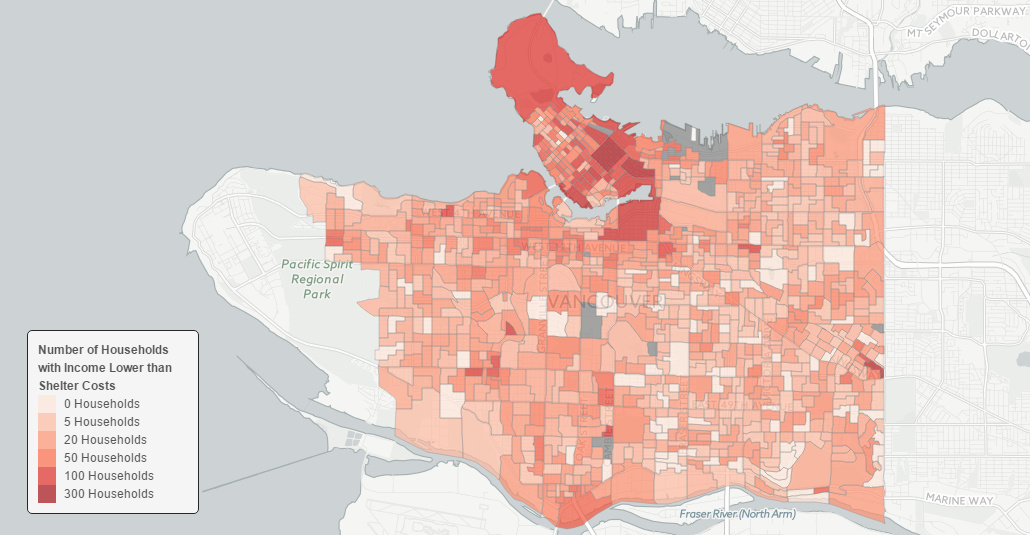
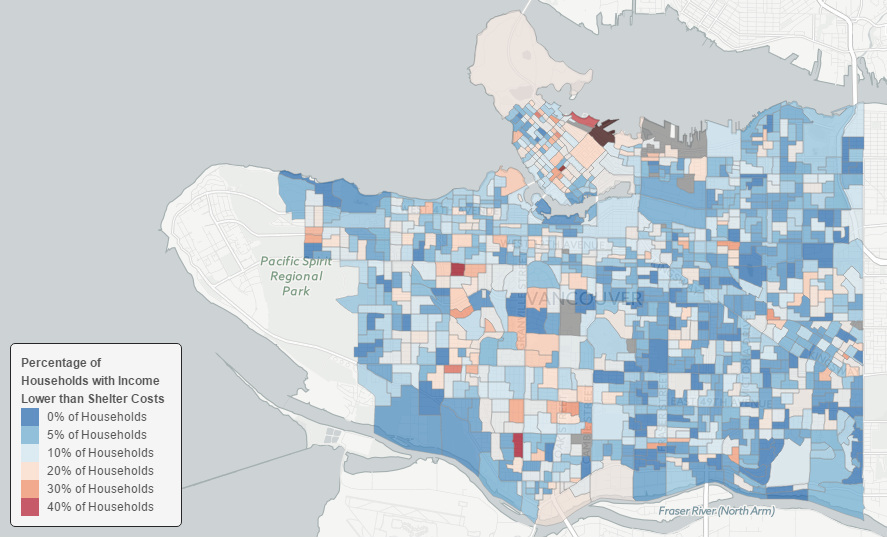
At the epicenter of Canada’s housing bubble, which is now rated as the most overvalued in the world, is the west coast city of Vancouver. It’s there that low interest rates and foreign buying have fueled the average detached home price to a record of C$1.47 million, a 20% increase from the previous year. While there are many measures of unaffordability, the government and federal agencies frequently use one such measure called the Shelter-cost to Income Ratio. It essentially compares the annual cost of an individual’s housing with the amount of income they have coming in each year. Federal agencies in Canada consider households that spend 30% or more of total before-tax household income on shelter expenses to have a “housing affordability” problem. In Vancouver, however, the city has become so unaffordable that 25,000 households pay more for their shelter costs than their entire declared income. This works out to 9.5% of the households in the city – far higher than Greater Toronto (5.9%) or Montreal (5%). We recently stumbled across a data mapping project by Jens von Bergmann, via the Hongcouver blog. Von Bergmann, who runs a data firm in Vancouver, has compiled a series of interactive maps that overlay census data onto the city. In Canada, the mandatory census happens every five years and creates a wealth of granular information. Here’s the percent of people in each city block that pay more for housing than they take home in income:
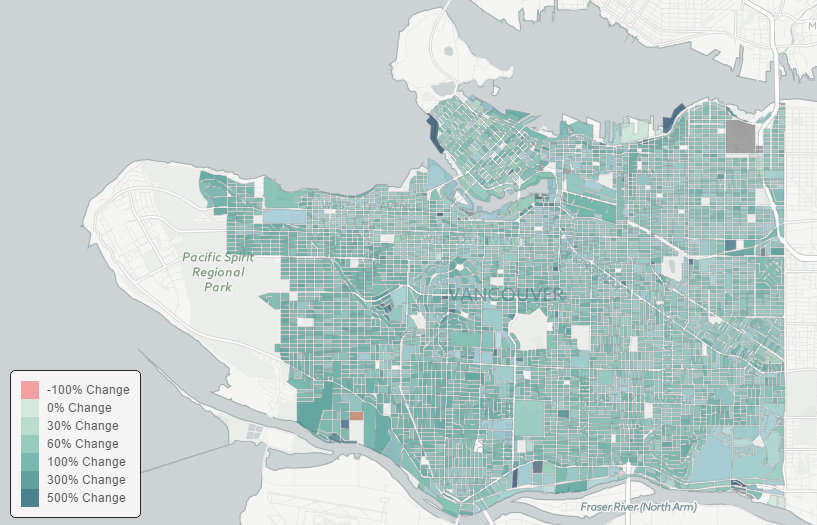
In an example neighborhood pocket (dissemination area 59150581) located between Arbutus and Macdonald streets, 44.8% of households pay more for shelter than they bring in for income. The average value for each “shelter”? A cool C$1.98 million. Yet, the median individual income in the area is only C$19,993. Things get stranger yet in Vancouver’s high-end Coal Harbour neighborhood, where somehow 62% of households claim to have lower income than shelter costs. In a pocket of Yaletown, 50% of people make less than the cost of their housing. While the precision of the data is excellent, the only problem with it is that the last census in Canada took place in 2011. Four years ago, housing prices were a fraction of what they are today. Compare today’s price of a detached home (C$1.47 million) to the price in August 2011: C$888,243. Have median wages jumped this much? Not likely – the problem is only getting worse. Here’s how the value of land has changed by block from 2006 to 2014 according to some of von Bergmann’s other data based on City of Vancouver assessment records:
Despite the country entering a technical recession, consumers having record-high debt, and commodity markets getting routed, Vancouver’s market is still flying high today. Housing sales in August 2015 were up 28% compared to the ten-year average, and the median price in Vancouver’s west side is entering “crazy” territory at C$2.87 million. While it is true that shelter in the epicenter of Canada’s housing bubble may seem quite expensive, at least the homes don’t look like crack shacks. Or do they?
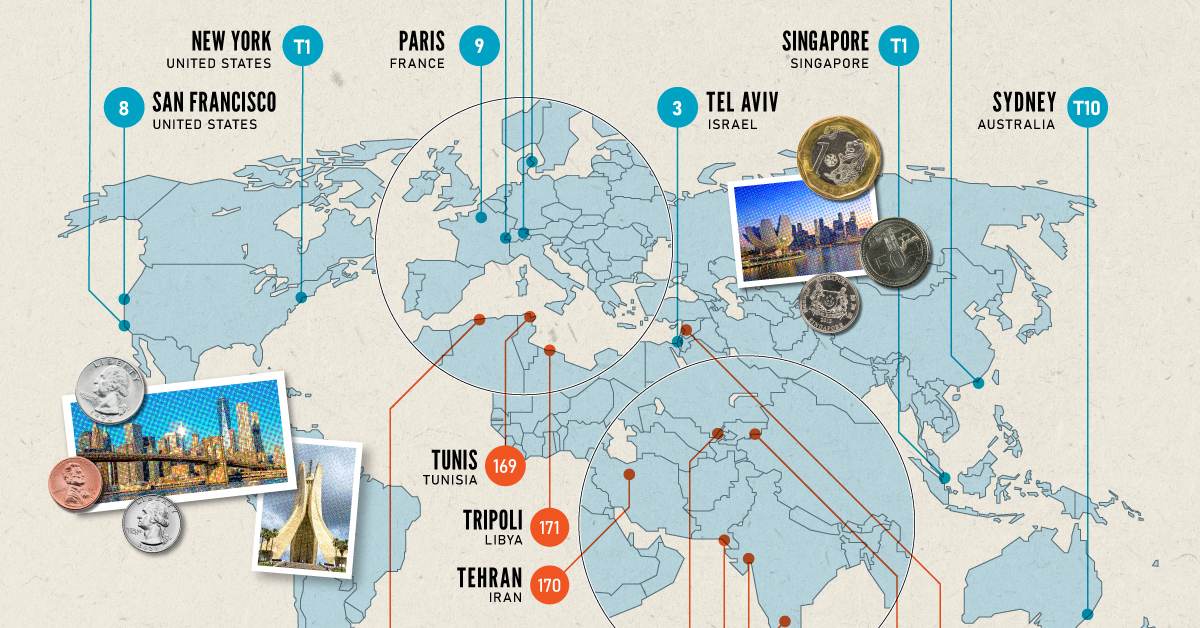
on Cities become “expensive” due to a variety of factors such as high demand for housing, a concentration of high-paying businesses and industries, and a high standard of living. Additionally, factors such as taxes, transportation costs, and availability of goods and services can also contribute to the overall cost of living in global cities. The infographic above uses data from EIU to rank the world most and least expensive cities to live in. To make the list, the EIU examines 400+ prices for over 200 products and services in 172 cities, surveying a variety of businesses to track price fluctuations over the last year.
Inflation + Strong Currency = Expensive Cities
If you live in a city where many residents find it challenging to put a roof over their heads, food on their plates, and make ends meet, you live in an expensive city. But if this inflation is compounded with a strong national currency, you may live in one of the world’s most expensive cities. Singapore and New York City tied for the first rank amongst the world’s most expensive cities in 2022, pushing Israel’s Tel Aviv from the first place in 2021 to the third place in 2022. Both these cities had high inflation and a strong currency. Surprisingly, this is the Big Apple’s first time atop the ranking. The city with one of the most expensive real estate markets worldwide, Hong Kong ranked fourth in this list, followed by Los Angeles, which moved up from its ninth rank in 2021.
Poor Economies = Cheaper Cities
Asia continues to dominate the list of the world’s least expensive cities, followed by parts of North Africa and the Middle East. Though affordability sounds good at face value, sitting at the bottom of the ranking isn’t necessarily a coveted position. While the cost of living in some of the cities in these nations is low, it comes at the price of a weak currency, poor economy, and, in many cases, political and economic turmoil. The decade-long conflict in Syria weakened the Syrian pound, led to a spiraling inflation and fuel shortages, and further collapsed its economy. It’s no surprise that its capital city of Damascus has maintained its position as the world’s cheapest city. Tripoli and Tehran, the capitals of Libya and Iran, respectively, follow next on this list, reflecting their weakened economies. Meanwhile, seven cities in Asia with the common denominator of high-income inequality and low wages dominate the list of the world’s cheapest cities. These include three Indian cities, Tashkent in Uzbekistan, Almaty in Kazakhstan, Pakistan’s most populous city of Karachi, and Sri Lankan capital–Colombo.