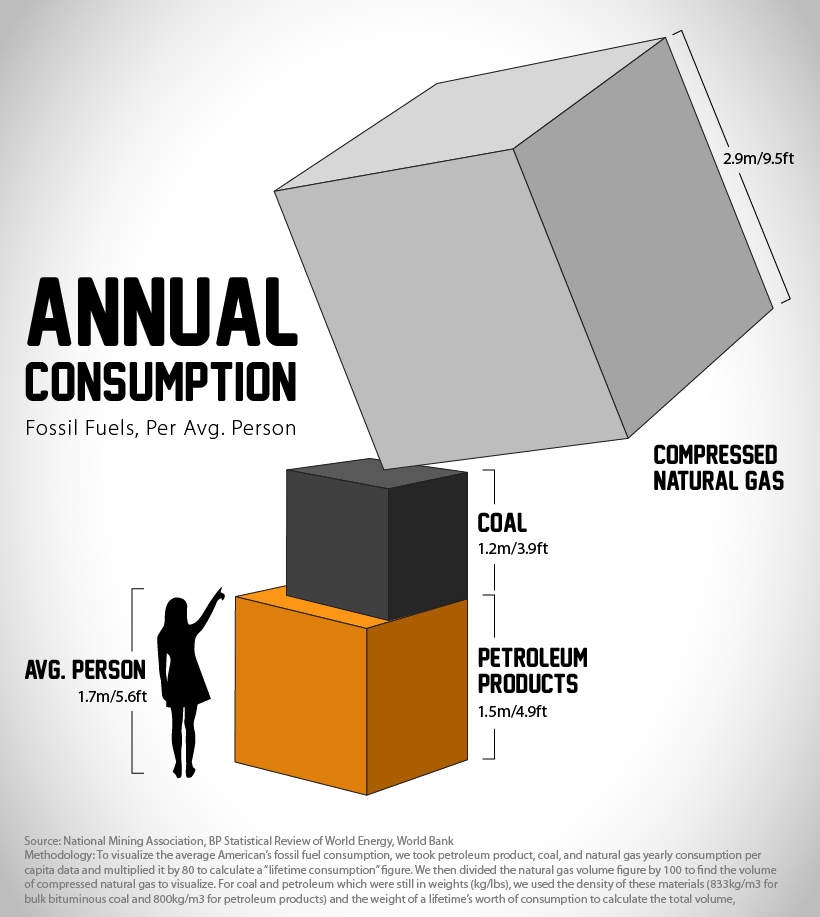
From burning natural gas to heat our homes to the petroleum-based materials found in everyday products like pharmaceuticals and plastics, we all consume fossil fuels in one form or another. In 2021, the world consumed nearly 490 exajoules of fossil fuels, an unfathomable figure of epic proportions. To put fossil fuel consumption into perspective on a more individual basis, this graphic visualizes the average person’s fossil fuel use over a lifetime of 80 years using data from the National Mining Association and BP’s Statistical Review of World Energy.
How Many Fossil Fuels a Person Consumes Every Year
On a day-to-day basis, our fossil fuel consumption might seem minimal, however, in just a year the average American consumes more than 23 barrels of petroleum products like gasoline, propane, or jet fuel. The cube of the average individual’s yearly petroleum product consumption reaches around 1.5 meters (4.9 feet) tall. When you consider varying transportation choices and lifestyles, from public transit to private jets, the yearly cube of petroleum product consumption for some people may easily overtake their height.
To calculate the volume needed to visualize the petroleum products and coal cubes (natural gas figures were already in volume format), we used the densities of bulk bituminous coal (833kg/m3) and petroleum products (800kg/m3) along with the weights of per capita consumption in the U.S. from the National Mining Association. These figures are averages, and can differ per person depending on a region’s energy mix, transportation choices, and consumption habits, along with other factors.
Global Fossil Fuel Consumption Rebounds Post-Pandemic
When the global economy reopened post-pandemic, energy demand and consumption rebounded past 2019 levels with fossil fuels largely leading the way. While global primary energy demand grew 5.8% in 2021, coal consumption rose by 6% reaching highs not seen since 2014. In 2021, renewables and hydroelectricity made up nearly 14% of the world’s primary energy use, with fossil fuels (oil, natural gas, and coal) accounting for 82% (down from 83% in 2020), and nuclear energy accounting for the remaining 4%. Recent demand for fossil fuels has been underpinned by their reliability as generating energy from renewables in Germany has been inconsistent when it’s been needed most. Now the country grapples with energy rations as it restarts coal-fired power plants in response to its overdependence on Russian fossil fuel energy as the potential permanence of the Nord Stream 1 natural gas pipeline shutdown looms.
Growing Green Energy Amidst Geopolitical Instability
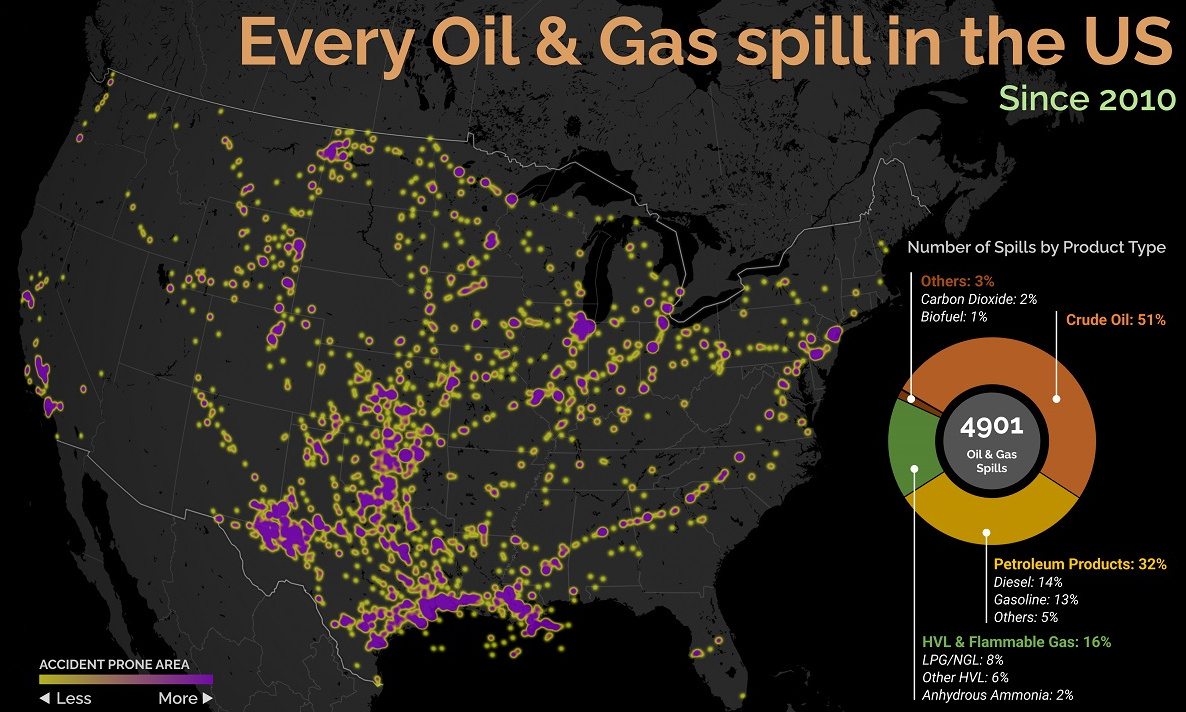
Domestic energy and material supply chain independence quickly became a top priority for many nations amidst Russia’s invasion of Ukraine, Western trade sanctions, and increasingly unpredictable COVID-19 lockdowns in China. Trade and energy dependence risks still remain a major concern as many nations transition towards renewable energy. For example, essential rare earth mineral production, and solar PV manufacturing supply chains remain dominated by China. Despite looming storm clouds over global energy and materials trade, renewable energy’s green linings are growing on the global scale. The world’s renewable primary energy consumption reached an annual growth rate of 15%, outgrowing all other energy fuels as wind and solar provided a milestone 10% of global electricity in 2021. If the global energy mix continues to get greener fast enough, the cubes of our personal fossil fuel consumption may manage to get smaller in the future. on Aside from the obvious climate impact they bring, one other downside in particular is spills, which can lead to ecological and economic damage. These can happen due to pipeline leaks, train derailments, or other industrial disasters. This graphic from Preyash Shah provides a visual overview of every oil and gas spill in the contiguous U.S. since 2010. Data is tracked by the U.S. government’s Pipeline and Hazardous Materials Safety Administration (PHMSA).
U.S. Oil and Gas Spills (2010‒2022)
The majority of spills that have occurred come mostly from crude oil, followed by petroleum products and gas. Note that this data covers the quantity of spills and not damages or volume.
Crude oil, which makes up just over half of documented spills, is also one of the most costly. Contaminations can persist for years after a spill, and its impact on local mammals and waterfowl is particularly harsh. This has been the case with the Deepwater Horizon spill (also known as the “BP oil spill”), which experts say is still causing harm in the Gulf of Mexico. Other products with lots of spills include petroleum products such as diesel or gasoline, as well as liquefied natural gas or other volatile liquids. Interestingly, liquefied carbon dioxide can also be transported in pipelines, commonly used for carbon capture storage, but requires high pressure to maintain its state. When looking at the location of spills, it’s clear that the South Central states have experienced the highest number of disasters. In contrast, the West Coast has had substantially less activity. However, this makes much more sense when looking at the dominant oil producing states, where Texas and surrounding neighbors reign supreme. Of the 4,901 spills during this period, Texas accounts for 1,936 or roughly 40% of all oil and gas spills. This is followed by Oklahoma, which has had 407 spills and is one of the largest net exporters of oil and gas in the country.
What Causes Spills?
Oil and gas spills actually have a surprisingly long history, with one of the earliest dating back to 1889, when a spill was reported on the coast between Los Angeles and San Diego. Causes have consisted primarily of weather, natural disasters, equipment and technological malfunction, as well as human error. However, they only became a widespread problem around the halfway mark of the 20th century, when petroleum extraction and production really began to take off. This era also saw the emergence of supertankers, which can transport half a million tons of oil but therefore make the risk of spills even costlier. In fact, the biggest spill off U.S. waters after the Deepwater Horizon disaster is the 1989 Exxon Valdez spill in Alaska, when a tanker crashed into a reef and 11 million gallons of oil spilled into the Pacific Ocean.